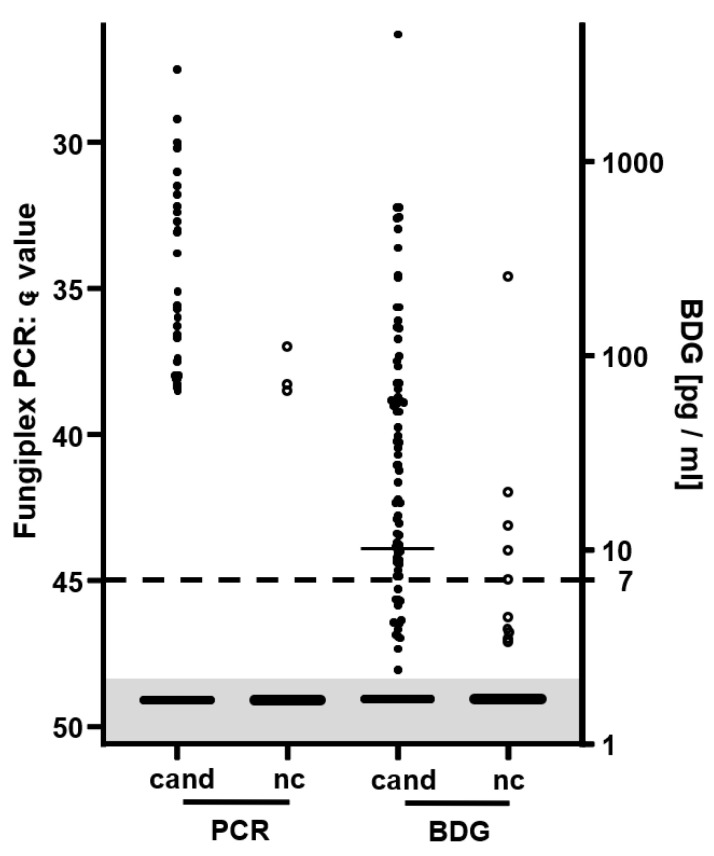
Figure 1.
Plot of analytical measuring results of sera of candidemia patients (cand; full circles) and negative controls (nc; empty circles). The dotted line indicates the cut-off of both assays. For samples, which were tested positive in more than one PCR, only one result was considered for this graph. BDG concentrations below the limit of detection and negative PCR results are plotted (not to scale) in the grey shaded area.

