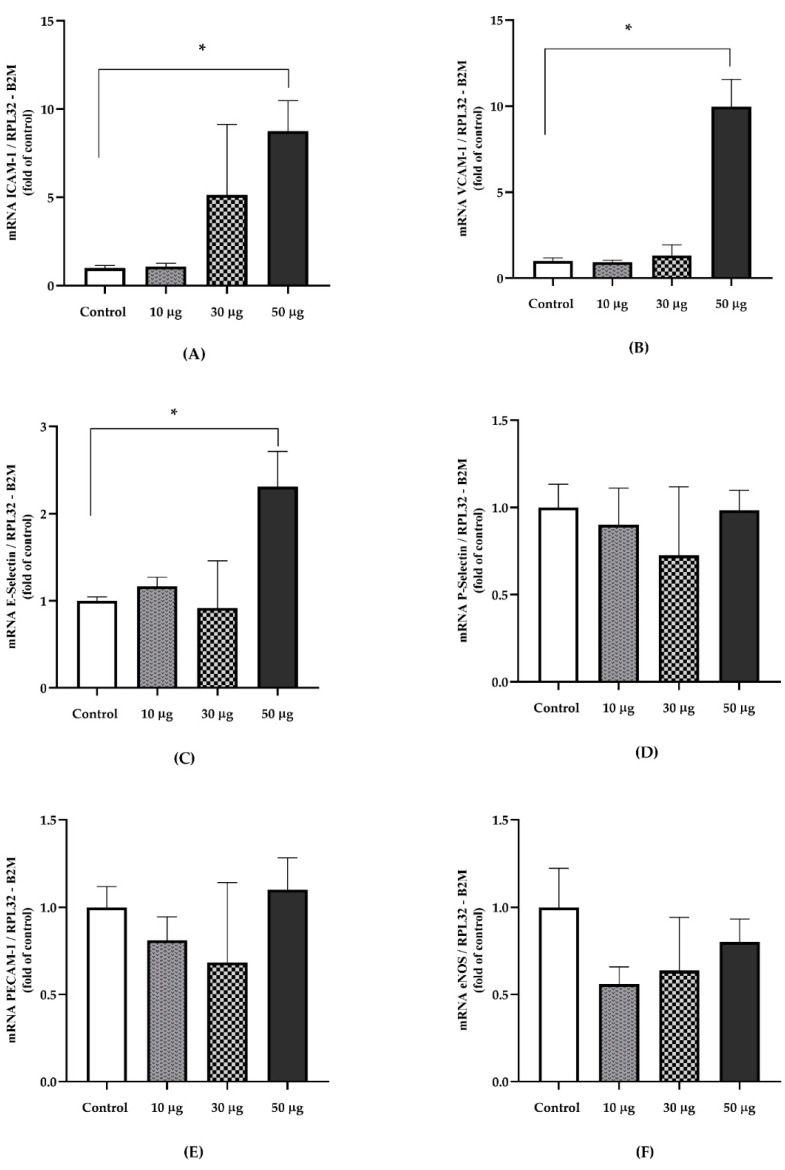
Figure 3.
The relative gene expression of endothelial dysfunction markers in the aortic tissue of animals exposed to PAHs and controls. (A) ICAM-1 (p = 0.047) † [Control v/s 10 µg, p = 0.944]; [Control v/s 30 µg, p = 0.655]; [Control v/s 50 µg, p = 0.041]. (B) VCAM-1 (p = 0.023) † [Control v/s 10 µg, p = 0.981]; [Control v/s 30 µg, p = 0.910]; [Control v/s 50 µg, p = 0.023]. (C) E-Selectin (p = 0.048) ‡ [Control v/s 10 µg, p > 0.9999]; [Control v/s 30 µg, p > 0.999]; [Control v/s 50 µg, p = 0.033]. (D) P-Selectin (p = 0.986) ‡. (E) Pecam-1 (p = 0.705) ‡. (F) eNOS (p = 0.396) †. Relative quantification was calculated using the reference genes RPL32 and B2M. Data are presented as the means ± SEM. † Welch’s ANOVA with Dunnett’s multiple comparisons test. ‡ Kruskal–Wallis with Dunn’s post hoc analysis (Control, n = 4; 10 µg, n = 4; 30 µg, n = 4; 50 µg, n = 4).* p < 0.05.

