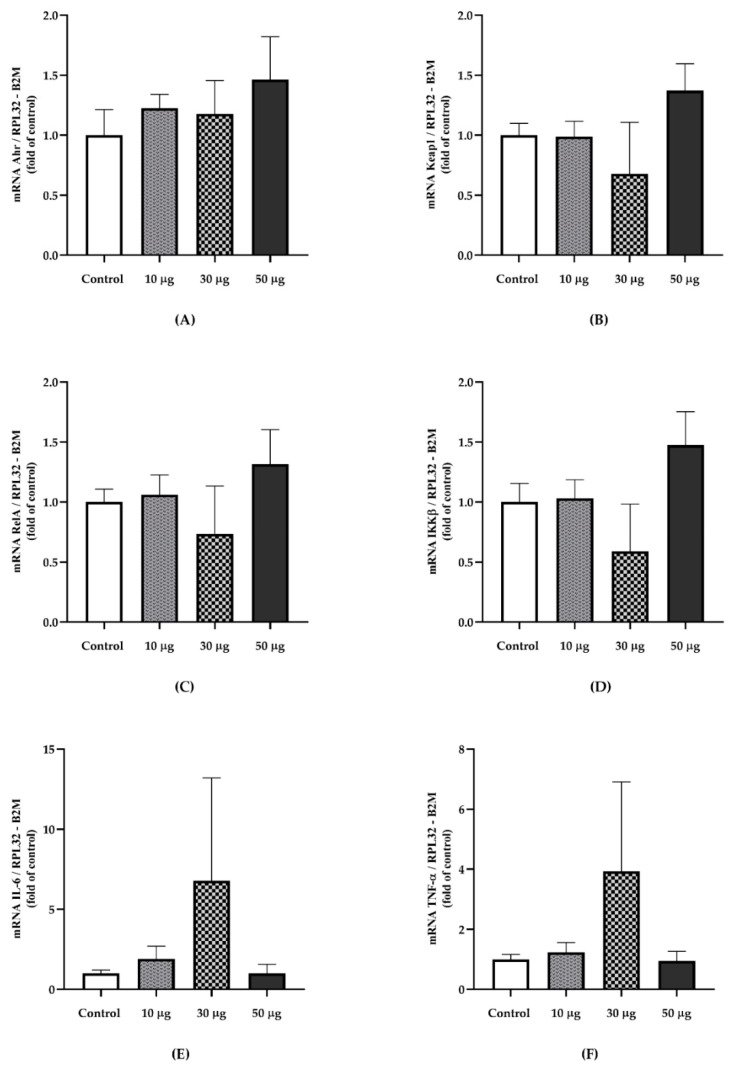
Figure 4.
The relative gene expression of exposure-related PAHs and inflammatory markers in aortic tissue from PAH exposed animals and the controls. (A) Ahr (p = 0.789) ‡. (B) Keap1 (p = 0.507)‡. (C) RelA (p = 0.679) ‡. (D) IKK-β (p = 0.450) †. (E) IL-6 (p = 0.878) ‡. (F) TNF-α (p = 0.760) †. Gene expression was normalized using the RPL32 and ACTB as reference genes. Data are presented as mean ± SEM. † Welch’s ANOVA test. ‡ Kruskal–Wallis test (Control, n = 4; 10 µg, n = 4; 30 µg, n = 4; 50 µg, n = 4).

