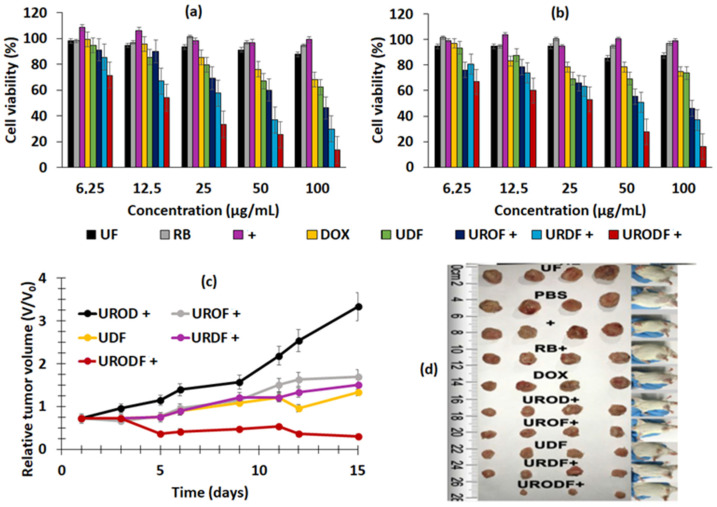
Figure 14.
MTT assays for cell viability of (a) 4T1 and (b) HeLa cells incubated with different products and concentrations for 24 h. (c) Tumor volume growth curves and (d) dynamic body change of mice in groups receiving UROD+, UROF+, UDF, URDF+ and URODF+ treatments over a period of 14 days (+ = laser irradiation (808 nm, 0.5 W/cm2, 0 to 150 s)). Figures (a–c) adapted from Xie et al. [34]. Figure (d) reprinted with permission from Xie et al. [34]. Copyright 2019 American Chemical Society.

