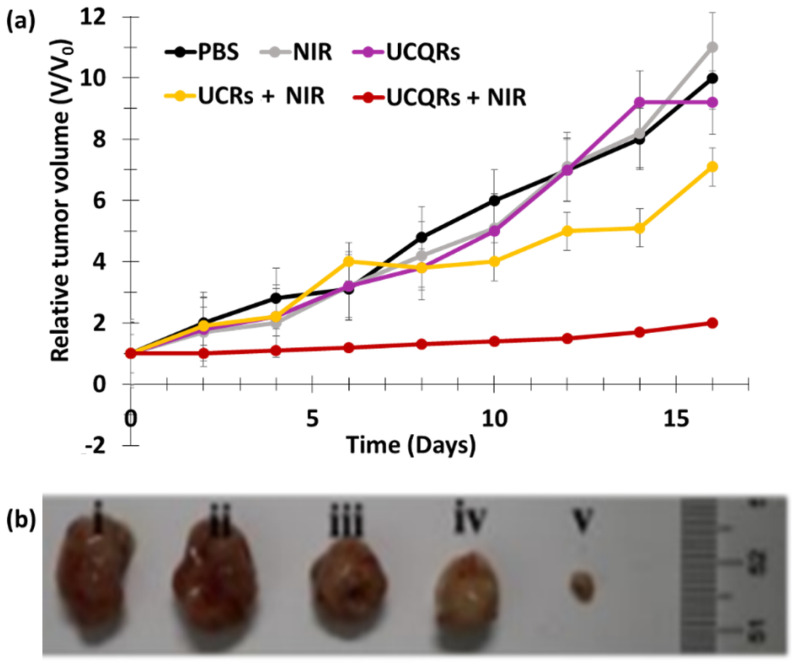
Figure 15.
(a) Relative tumor volume obtained from mice with various treatments. (b) Representative photographs of the corresponding excised tumors (i—PBS, ii—NIR, iii—UCQRs (10 mg/mL, 40 µL), iv—UCRs + NIR (10 mg/mL, 40 µL), and v—UCQRs + NIR) (10 mg/mL, 40 µL). NIR irradiation (808 nm, 1.6 W/cm2, 10 min). Figure (a) adapted from Song et al. [37]. Figure (b) reprinted from Song et al. [37]. Copyright 2019 American Chemical Society.

