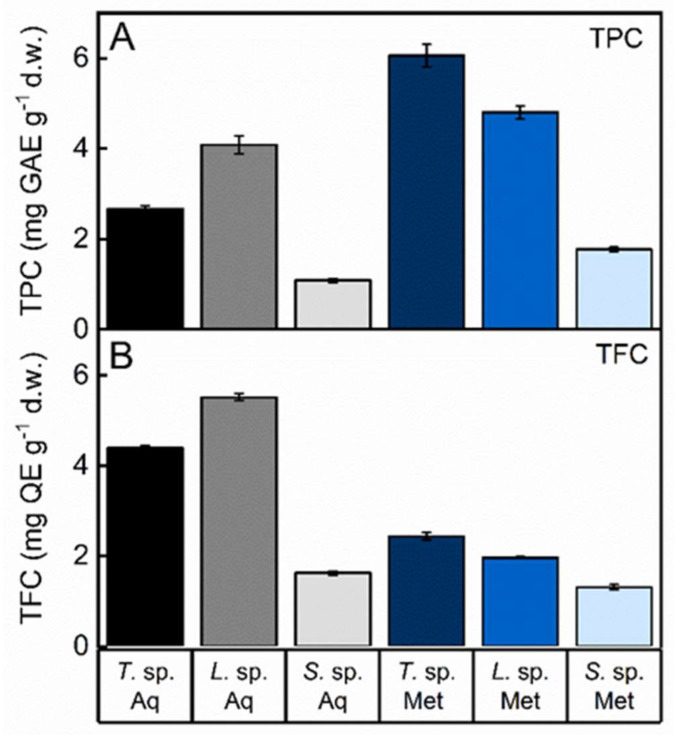
Figure 2.
Total phenolic content (TPC) (A) and total flavonoid content (TFC) (B) of the aqueous (Aq) and methanol (Met) fungal extracts of Trametes sp. S2.OA.C_F6 (T. sp.), Lenzites sp. S3.OA.B_F6 (L. sp.) and Sistotrema sp. S1.OA.C_F2 (S. sp.). TPC was expressed in terms of gallic acid equivalent (GAE) g−1 dry weight; TFC was expressed as quercetin equivalent (QE) g−1 dry weight. Data were reported as mean values ± standard deviation (SD) of triplicates.

