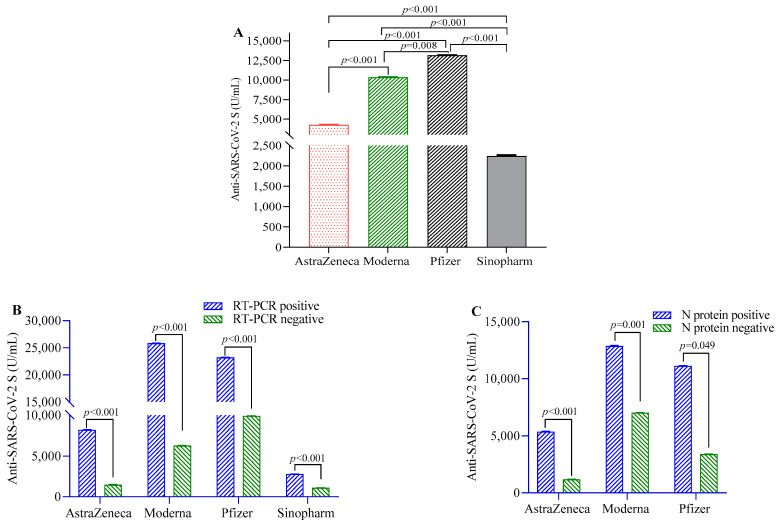
Figure 1.
SARS-CoV-2 S-protein-specific antibody levels in study participants after two doses of vaccination. (A) Comparison of antibody levels between different SARS-CoV-2 vaccines; (B) differences in antibody titer between RT-PCR positive and negative participants; (C) comparison of antibody levels between participants positive and negative for SARS-CoV-2 N-protein-specific antibody. A 2-way ANCOVA model was used to estimate the p-value, and the model was adjusted for age, sex, income and BMI.

