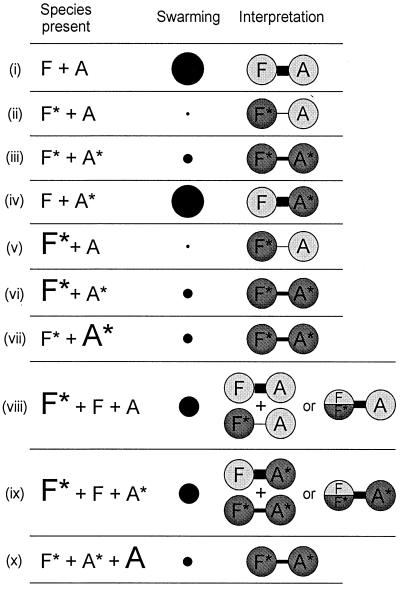
FIG. 8.
Schematic illustration of effects of FliF and FlhA overproduction (as a result of expression from pTrc99A-based plasmids) on swarming in various host backgrounds. (i) Wild-type, untransformed or transformed with vector; (ii) parental FliF∗ mutant, untransformed or transformed with vector; (iii) FliF∗ FlhA∗ pseudorevertant, untransformed or transformed with vector; (iv) second-site FlhA∗ mutant, untransformed or transformed with vector; (v) parental FliF∗ mutant with FliF∗ overexpressed; (vi) FliF∗ FlhA∗ pseudorevertant with FliF∗ overexpressed; (vii) FliF∗ FlhA∗ pseudorevertant with FlhA∗ overexpressed; (viii) wild-type with FliF∗ overexpressed; (ix) second-site FlhA∗ mutant with FliF∗ overexpressed; (x) FliF∗ FlhA∗ pseudorevertant with FlhA overexpressed. F, wild-type FliF; F∗, mutant FliF; A, wild-type FlhA; A∗, mutant FlhA. Chromosomal expression is indicated by the smaller font, while plasmid expression is indicated by the larger font. Swarming ability is indicated qualitatively by the diameter of the black circles, categorized by four levels: wild-type, intermediate, pseudorevertant, and parental. The data are interpreted in terms of a physical interaction between FliF and FlhA subunits, where the strength of the interaction is indicated by the thickness of the connecting bar. Wild-type proteins are indicated by light shading, and mutant proteins are indicated by dark shading. In cases (viii) and (ix), the possibility of a mixed (FliF|FliF∗) multimer is indicated (see text).

