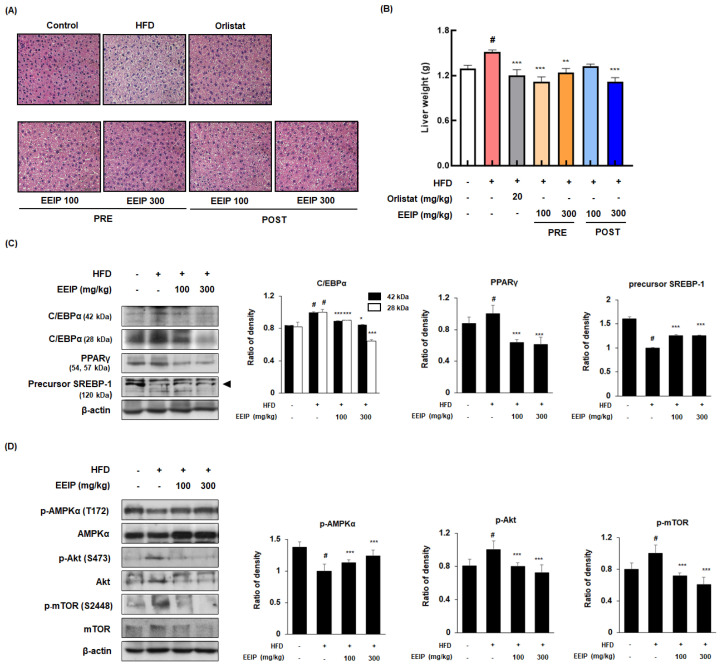
Figure 7.
Effect of EEIP on liver fat accumulation in HFD−fed obese mice. (A) H&E−stained images from section slides of the liver tissue. (B) Assessment of liver weight. (C,D) Adipogenic−related protein expression of the liver tissue was determined by Western blotting analysis and β-actin was used as the internal control. Densitometric analysis was performed using Bio−Rad Quantity One Software (BioRad; Hercules, CA, USA). Values are represented as the mean ± SEM. # p < 0.05 vs. normal diet control group; * p < 0.05, ** p < 0.01, and *** p < 0.001 vs. HFD group.

