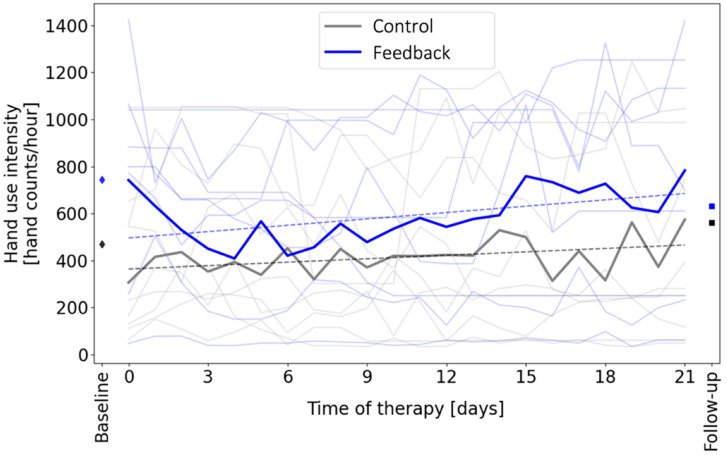
Figure 6.
Effect of feedback on hand use intensity. The light lines show data from individuals in order to show variability within and across participants. The dark lines show the group averages. The feedback group significantly increased their hand count intensity over time (dashed line, linear regression, p = 0.012, slope = 9.0 hand counts/hour per day, which amounted to ~2000 additional counts per day by study end), while the control group did not (p = 0.059; slope = 4.87 hand counts/hour per day). The diamonds and squares show the hand use intensity measured at baseline and follow-up, respectively, when the feedback screen was turned off for all participants. Hand use intensity was not significantly different between groups on the baseline or follow-up days (t-test, p > 0.05).

