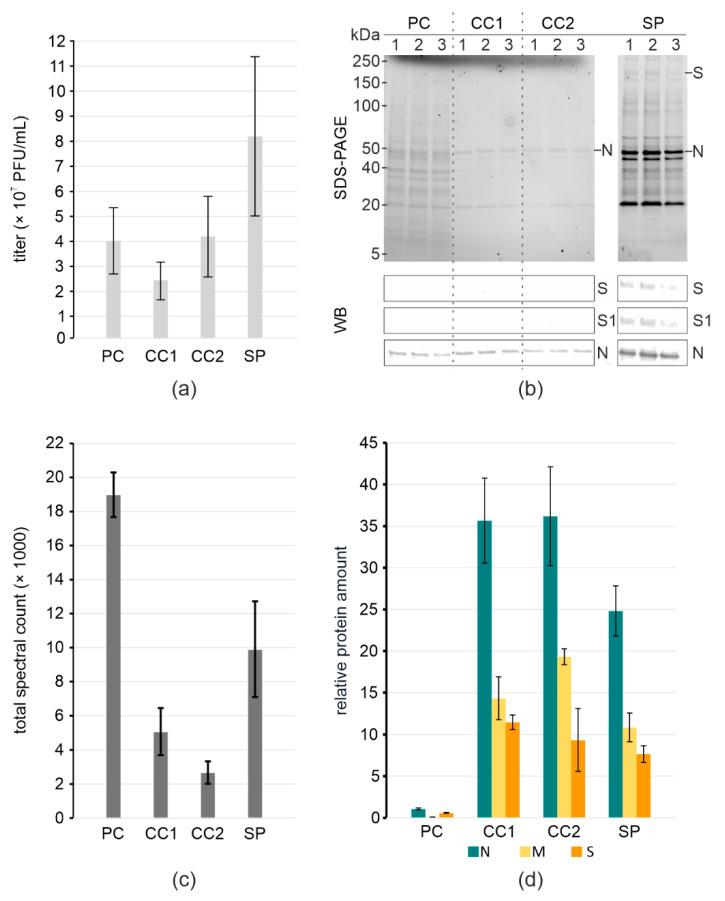
Figure 1.
Virus yield and purity at different purification steps. (a) Virus titers; (b) SDS-PAGE of total protein content and WB of S and N in samples. Molecular weight markers are indicated on the left; (c) Total spectral counts of peptides detected in samples; (d) Relative protein amount in samples normalized to ORF9b. (a–d) pre-cleared stock (PC), Capto Core 1× (CC1), Capto Core 2× (CC2); pelleting through 20% sucrose (SP).

