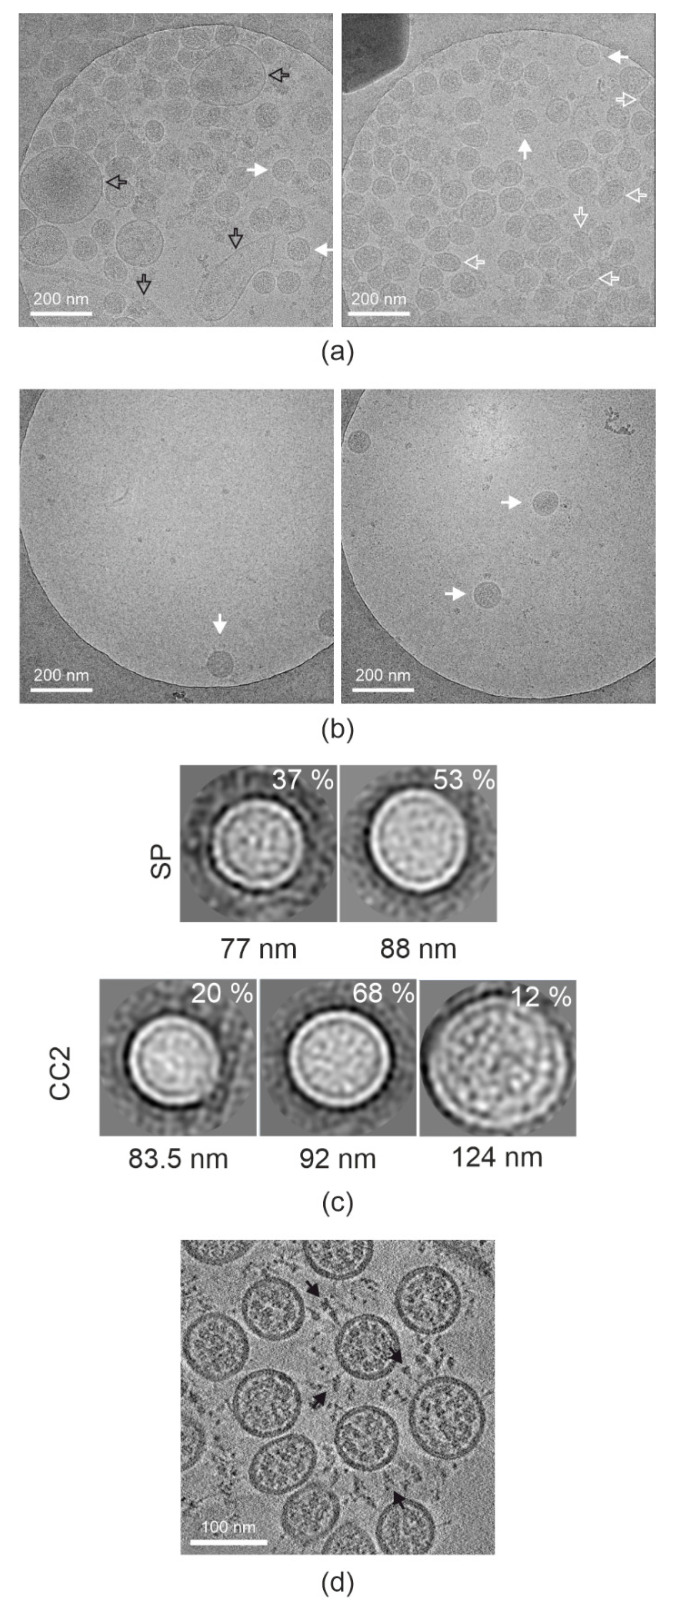
Figure 3.
Morphology of inactivated SARS-CoV-2 particles. (a) Representative micrographs of SP SARS-CoV-2. (b) Representative micrographs of CC2 purified and concentrated SARS-CoV-2. (a,b) Images taken at −6 µm defocus; Intact SARS-CoV-2 particles (full white arrows), deformed particles (empty white arrows), and contaminating cellular derivatives (empty black arrows) are indicated. (c) Class averages of 100 particles picked from the imaged SP micrographs in the top row, and from 100 particles picked from the imaged CC2 concentrated micrographs in the bottom row. The percentage of the particles in the class is shown inside each box, and the average diameter of each class is shown below the box. The box size is 140.25 nm × 140.25 nm. (d) A section through a tomogram of concentrated Capto Core 2× purified SARS-CoV-2. Pre-fusion spikes are indicated by full black arrows. Tomogram was collected at −3 µm defocus.

