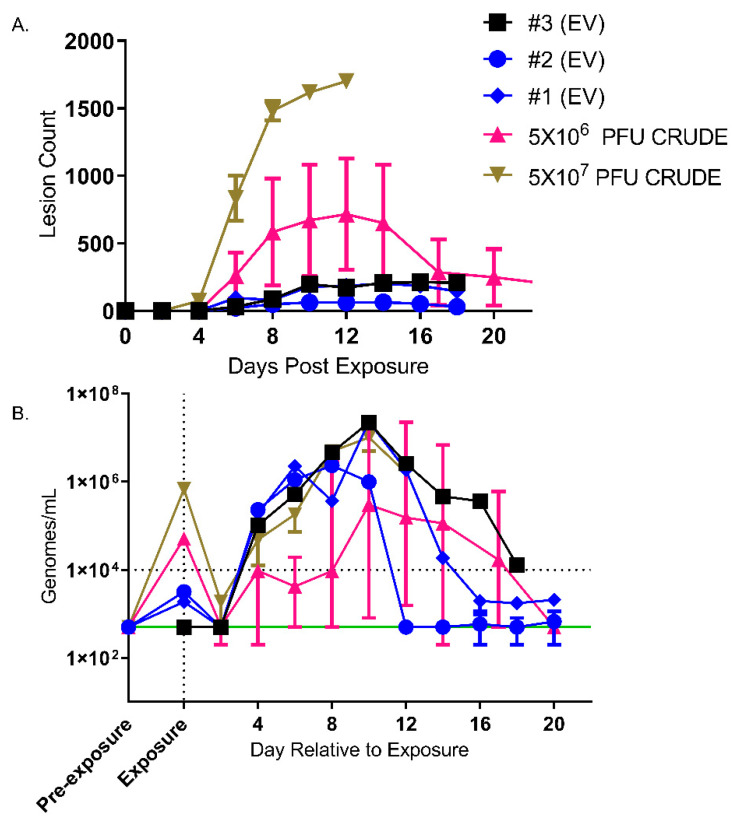
Figure 4.
Assessment of lesion burden and QPCR. Lesions (A), viremia (QPCR) (B) over time are shown. Mean with standard error of the mean is shown for lesion counts (A) and median and error are shown for QPCR data (B). Animal #3 (EV) was shown to have extravasation of the challenge inoculum and is shown in black (square symbol). Green line, lower limit of detection. Horizontal dotted line, lower limit of quantitation. Blood obtained previous to exposure is shown on the X-axis as “Pre-exposure”. Blood obtained within 2 min of intravenous exposure was on Day 0 and is shown on the X-axis as “Exposure”.

