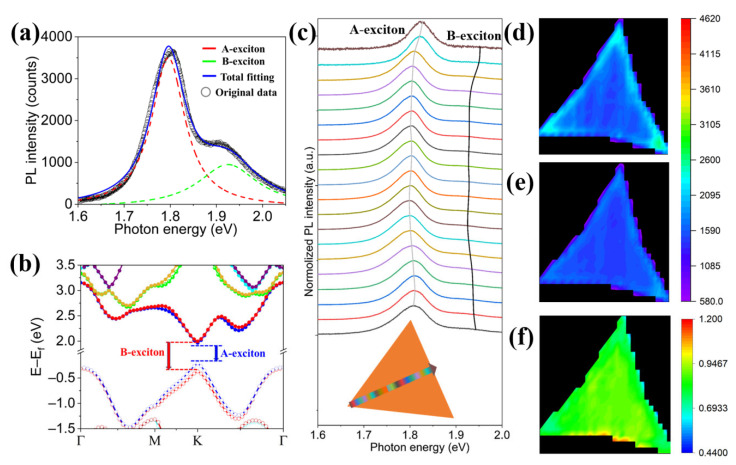
Figure 2.
(a) A typical PL spectrum of the monolayer MoS2. (b) The SOC-dependent band structure of the monolayer MoS2. The solid and hollow circle represent conduction and valence band, respectively. The energy levels are marked by different colors. (c) The PL spectra with linear scanning from the vertice to edge of the MoS2 triangle. The inset shows the scanning path and the colors of PL spectra indicate the site position. (d–f) The intensity mapping profiles of (d) A-exciton, (e) B-exciton, and (f) intensity ratio of B/A.

