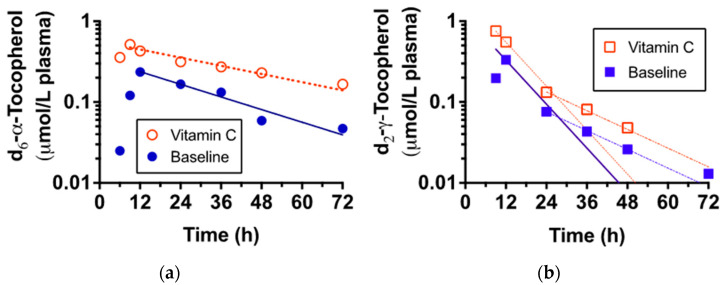
Figure 2.
The plasma d6-α- (a) and d2-γ-tocopherol (b) concentrations at baseline and after vitamin C supplementation (representative participant, #3). Plasma-labeled and unlabeled tocopherols were measured by LC/MS from blood samples periodically collected up to 72 h. Filled symbols denote baseline, open symbols denote vitamin C pharmacokinetics trial. Lines indicate post-peak exponential decay curves. The d2-γ-tocopherol rates of disappearance were so fast that the slopes were no longer linear after 36 h; thus, a second curve was fit to the data. Neither slope was altered by vitamin C status; only the slope from Tmax is reported.

