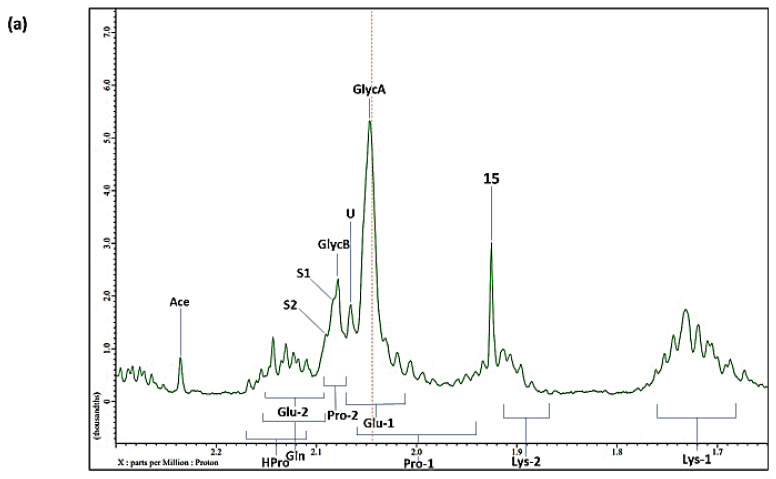
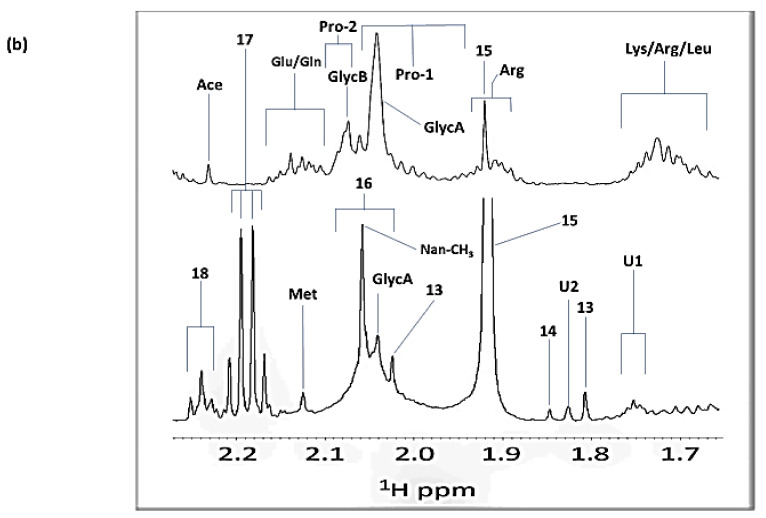
Figure 4.
1H NMR Analysis of APP Side-Chain N-Acetylsugar Residues Present in Human Saliva and Blood Plasma. (a) Expanded 1.65–2.30 ppm region of the 1H NMR WASTED-II spectral profile of healthy human blood plasma, showing potential interferences with the quantification of macromolecular GlycA and GlycB species arising from the free amino acids proline and glutamate, and low-molecular-mass N-acetylsugar and possible N-acetylamino acid metabolites. The red vertical line indicates the chemical shift value of free N-acetylglucosamine at δ = 2.044 ppm, which is very similar to that of the much broader GlycA signal. (b) Expanded 1.65–2.27 ppm regions of the 1H NMR WASTED-II spectra of human blood plasma (top) and WMSS (bottom) samples collected from healthy human participants to allow comparative evaluations of their acetamido-CH3 resonances, which arise from both low- and high-molecular-mass biomolecules in these biofluids. Typical spectra are shown. Spectra were recorded on a Jeol JNM-ECZ600R/S1 600 MHz spectrometer operating at frequency of 600.17 MHz for 1H, at a probe operating temperature of 25 °C. Assignment abbreviations: As Table 1, with Lys-1 and -2, lysine-γ- and β-CH2 groups, respectively; Pro-1 and -2, proline-γ- and β-CH2 groups, respectively; Glu-1 and -2, glutamate-β-CH2 resonances; Hpro, hydroxyproline-β-CH2; Gln, glutamine-β-CH2; Met, methionine-S-CH3; Ace, acetone-CH3; Nan-CH3, N-acetylneuraminate-CH3; S, S1, U and U1, unidentified resonances, those in the plasma profile shown in (a) may being ascribable to further 1H NMR-distinguishable -NHCOCH3 functions, with S1 possibly representing an N-acetylneuraminate signal in a molecular environment differing from that/those of GlycB; Arg, arginine-β-CH2; Leu, leucine-β-CH2 and γ-CH resonances.


