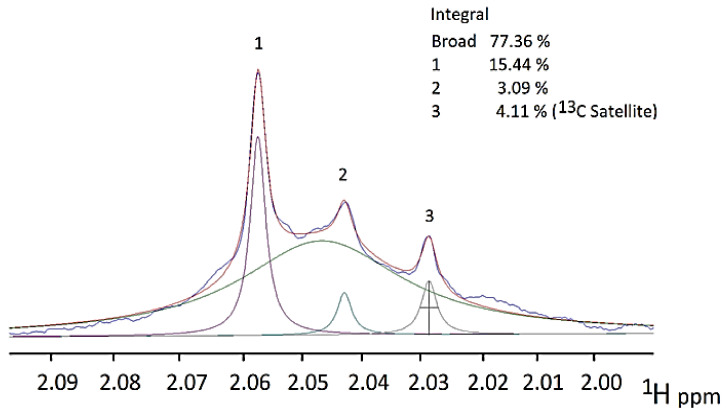
Figure 5.
Deconvolution of the 1H NMR Resonances of Salivary APP Side-Chain N-Acetylsugar Residues. Deconvolution line-fit of the signals present within the 1.99–2.10 ppm acetamido-CH3 group region of the 600 MHz 1H NMR profile of a typical human WMSS sample, which was achieved using Jeol Delta-5 software modelling. This deconvolution approach yielded a single major broad resonance (δ = 2.046 ppm) presumably ascribable the GlycA signal detectable in human blood plasma, and three sharper ones located at 2.059, 2.042 and 2.028 ppm (labelled 1, 2 and 3, respectively), which are assignable to free N-acetylneuraminate- and N-acetylglucosamine-NHCOCH3 group resonances, and the dominant acetate-CH3 group’s lower field 13C satellite (confirmed through the acquisition of 13C decoupling WET spectra (Figure 1c,d), respectively. The WMSS spectrum was acquired with a Jeol JNM-ECZ600R/S1 600 MHz spectrometer operating at frequency of 600.17 MHz for 1H, and at a probe operating temperature of 25 °C, using the noesy-presat pulse sequence, although only eight scans were required for this.

