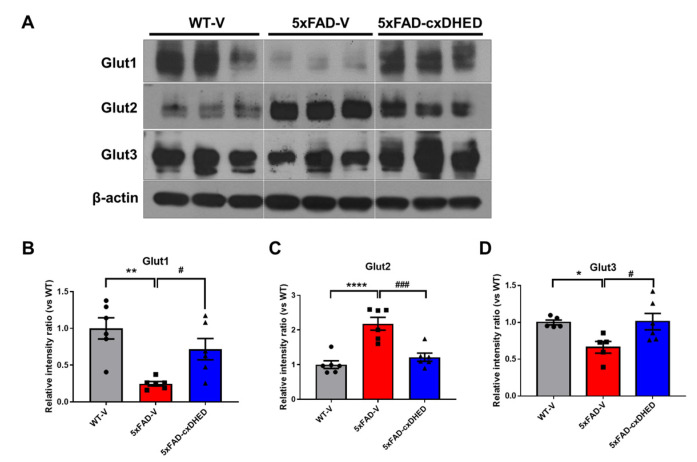
Figure 4.
cx-DHED rescued the abnormal expressions of glucose transporters in the brain of 5xFAD mice. (A) Protein expression levels of glucose transporters (GLUT) in the cortex of mice. (B) GLUT1 (WT-V; n = 6, 5xFAD; n = 6, 5xFAD-cx-DHED; n = 6), (C) GLUT2 (WT-V; n = 6, 5xFAD; n = 6, 5xFAD-cx-DHED; n = 6), and (D) GLUT3 (WT-V; n = 5, 5xFAD; n = 5, 5xFAD-cx-DHED; n = 6) expression levels were normalized to β-actin. Values are expressed as the mean ± standard error of the mean. * p < 0.05, ** p < 0.01, and **** p < 0.0001 vs. WT-V group; # p < 0.05 and ### p < 0.001 vs. the 5xFAD-V group. Statistical analysis between the three groups was performed using the one-way analysis of variance, followed by Turkey’s post hoc test.

