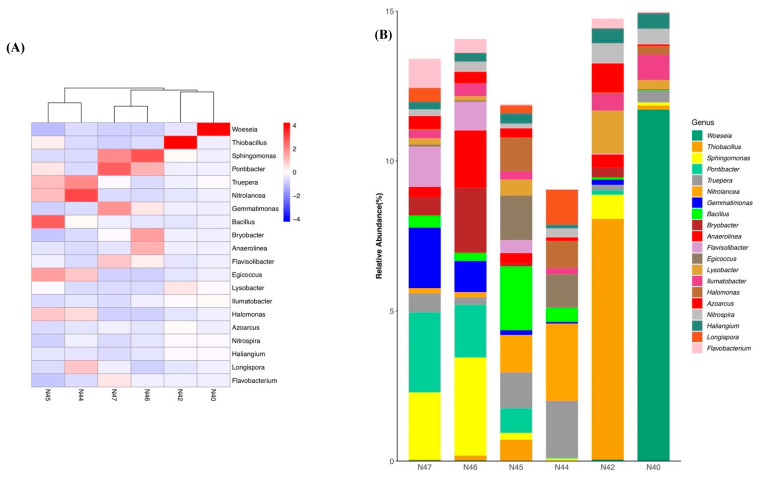
Figure 6.
Bacterial community composition at genus level. (A) Heatmap clustering based on distribution patterns of 20 most abundant genus-level OTU groups. The dendrogram showing the cluster dissimilarity between samples was constructed based on maximum distance. (B) Bar plots showing the relative abundances of bacterial genera in saline soil bacterial communities.

