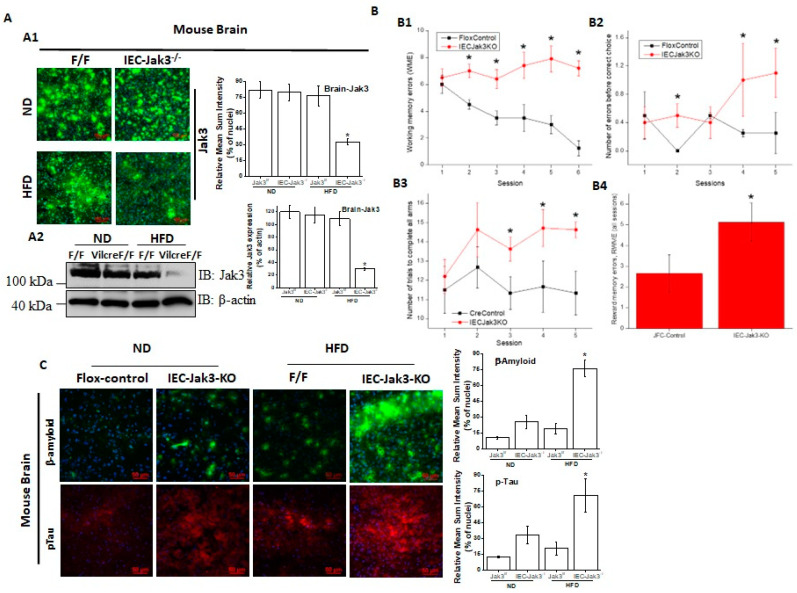
Figure 3.
IEC deficiency in Jak3 is responsible for cognitive impairment and increased cerebral cortex accumulation of Aβ and pTau during HFD-induced obesity: (A) IEC-Jak3 deficiency promotes HFD-mediated impacts on Jak3 expression in the brain in mice. Brain tissue sections (A1) or tissue-lysates (A2) from FL-control and corresponding IEC-Jak3-KO littermate mice fed with either ND or HFD were immunostained or Western blotted using Jak3 primary antibodies followed by FITC- or HRP-conjugated secondary antibodies, respectively. Mounting media containing PI were used to visualize the nucleus in A1. Representative images in A1 or blots in A2 (n = 10 and 3, respectively) are shown (Right panels). Quantifications of the florescent intensities in A1 or densitometric analyses in A2 in the corresponding “left panels” were performed using NikonR C1-plus imaging and BioRad software, respectively, and the results were normalized against PI in B1 or β-actin in B2 for Jak3 expression. (B) IEC-Jak3 deficiency promotes cognitive impairment during obesity. The four parameters of cognitive assessments, viz., WME (B1), EBCC (B2), RME (B3) and RWME (B4), were measured, as in Figure 1C. A repeated-measure ANOVA on performances of age- and sex-matched Jak3-flox (Flox-control) and littermate controls of IEC-Jak3-KO mice (n = 10 each group) is shown for each session (B1–3) or an average of all the sessions (B4). Data are representative of three independent experiments. Values are mean ± S.D. * denotes statistically significant compared with flox mice. (A1; p > 0.01, A2; p > 0.05, A3; p > 0.01, A4). (C) IEC-Jak3 deficiency promotes accumulation of β-Amyloid and pTau in mouse brain. Brain tissue sections from FL-control and corresponding IEC-Jak3-KO littermate mice fed with either ND or HFD were immunostained using β-amyloid or pTau or Jak3 primary antibodies followed by FITC- or Cy-3-conjugated secondary antibodies. Mounting media containing PI were used to visualize the nucleus. Representative images (n = 10) are shown (Right panels). Quantifications of the intensities in the “left panels” were performed using NikonR C1-plus imaging software, and the results were normalized against PI for β-amyloid (Upper right) and pTau (Lower right). Values are mean ± S.D. Asterisk denotes statistically significant p > 0.05 compared with flox mice group. (β-amyloid p = 0.005, pTau p = 0.003).

