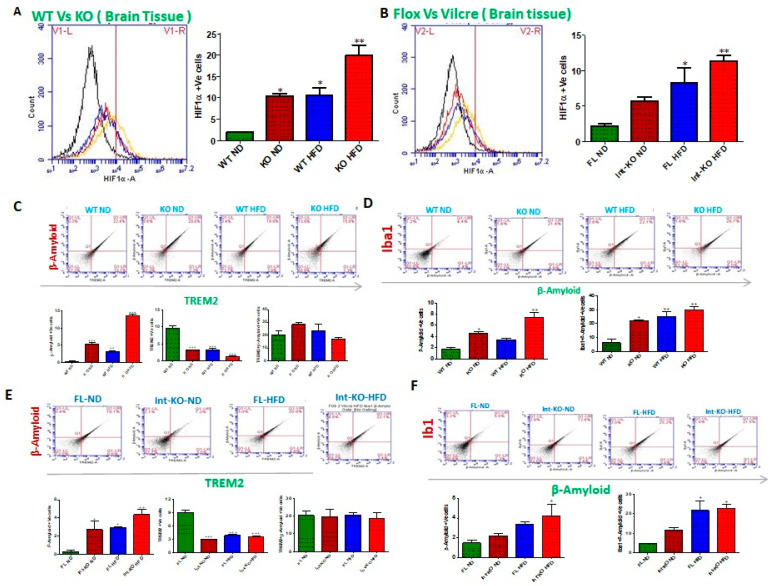
Figure 7.
Intestinal epithelial deficiency of Jak3 causes Brain-hypoxia led increase in microglial accumulation of Abeta in the brain. (A,B), Representative flow cytometric histogram graphs of individual mouse brain cells showing the levels of expression of hypoxia inducible factor 1-α (HIF1-α) in the four indicated groups of global Jak3 deficiency (A) and IEC Jak3 deficiency (B), respectively (n = 5/group), are shown in the left panel, and the corresponding histogram bar graphs indicating mean ± SD values in the right panels are shown for the comparative average cell counts for the indicated groups of mice. *, **, *** Indicate statistically significant difference from the corresponding controls (A: KO-ND#1 p = 0.06, WT-HFD#2 p = 0.05 KO-HFD#3 p = 0.04; B: Int-KO-ND#1 p = 0.06, FL-HFD#2 p = 0.05, Int-KO-HFD#3 p = 0.05). (C,D), FACS analysis is presented as four quadrant dot plots to determine the impact of global Jak3 deficiency on microglial accumulation of Abeta in the individual mouse brain tissues from “A” by determining the double positive cells (Quadrant:UR) for microglial Abeta receptor TREM-2 on the X axis and Abeta on the Y axis (C) and microglial marker Iba1 on the X axis and Abeta on the Y axis (D) under ND or HFD. The lower panels in “C” and “D” show the corresponding bar chart results following repeating (n = 5) the FACS experiments, and mean ± SD values are shown as bar graph for the comparative average cell counts for the indicated groups of mice. *, **, *** denote p < 0.04 in all groups. (E,F), similar strategies as in C-D were used to perform FACS analysis to determine the impact of intestinal epithelial Jak3 deficiency on microglial accumulation of Abeta in the individual mouse brain tissues from “B” in the indicated four groups under ND or HFD. *, **, *** denote statistically significant values in the indicated group assumed at p < 0.05.

