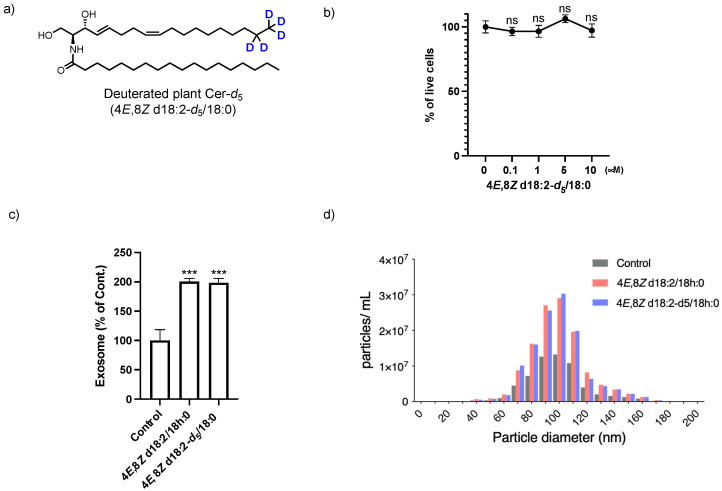
Figure 6.
(a) Structure of 4E,8Z d18:2-d5/18:0. (b) CCK-8 viability assay of SH-SY5Y cells exposed to 4E,8Z d18:2-d5/18:0. Results were normalized against controls and represented as the mean ± SD (n = 3). (c) Quantification of exosomes released from SH-SY5Y cells treated without (Control) or with 4E,8Z d18:2-d5/18:0 for 24 h. Exosomes were quantified using a PS-Capture Exosome ELISA system. Results were normalized against controls and represented as the mean ± SD (n = 3; *** p < 0.0001 vs. Control). (d) Particle size distributions of exosomes derived from control, and deuterium-labeled or unlabeled Cer-treated cells.

