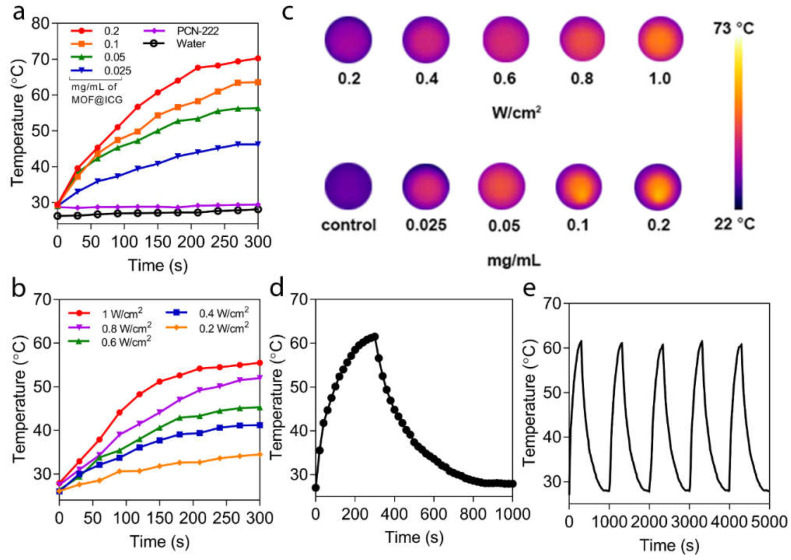
Figure 2.
Photothermal effect of PCN−222@ICG. (a) Concentration-dependent temperature increase for PCN−222@ICG. Here, PCN−222 with a concentration of 0.2 mg mL−1 and a DI water sample are used as control groups. (b) Power-density-dependent temperature increase of PCN−222@ICG. (c) Thermal images of PCN−222@ICG probes for various concentrations and power-densities. (d) Single heating/dissipation cycle of PCN−222@ICG. (e) Photothermal stability testing of PCN−222@ICG for five cycles.

