Figure 4.
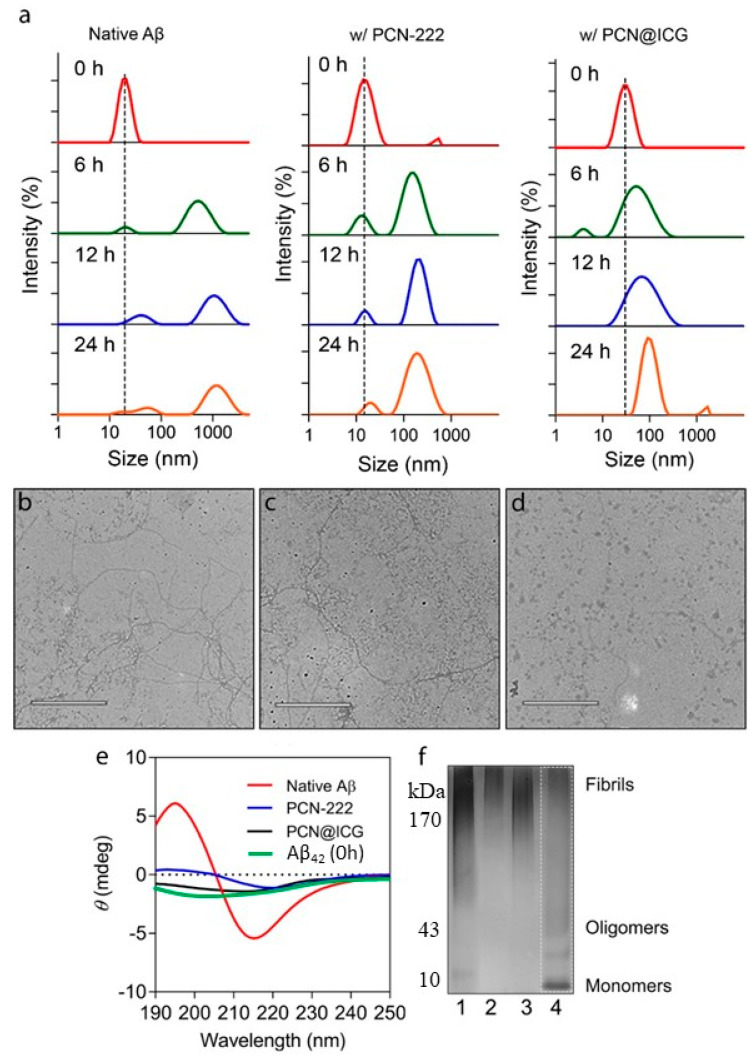
Inhibition effect on Aβ42 aggregation by photo-activated PCN−222 and PCN−222@ICG nanoprobes. (a) DLS analysis of sample size change at four time points of incubation (0 h, 6 h, 12 h, and 24 h) for Aβ42 samples without treatment, in the presence of photo-activated PCN−222, and in the presence of photo-activated PCN−222@ICG; TEM images of samples after 24 h of incubation (b) for native Aβ42 without any treatment, (c) in the presence of photo-activated PCN−222, and (d) in the presence of photo-activated PCN−222@ICG. (e) Circular dichroism analysis of native Aβ42, and Aβ42 with treatments of nanoprobes under NIR irradiation. (f) Native PAGE of Aβ42. 1: native Aβ42; 2: Aβ42 with PCN−222 under NIR irradiation; 3: Aβ42 with PCN−222@ICG without NIR irradiation; 4: Aβ42 with PCN−222@ICG under NIR irradiation. (The above experiments are under NIR irradiation with 0.025 mg mL−1, at 0.6 W cm−2, for 30 min.) The scale bars for TEM images are 500 nm.

