Figure 16.

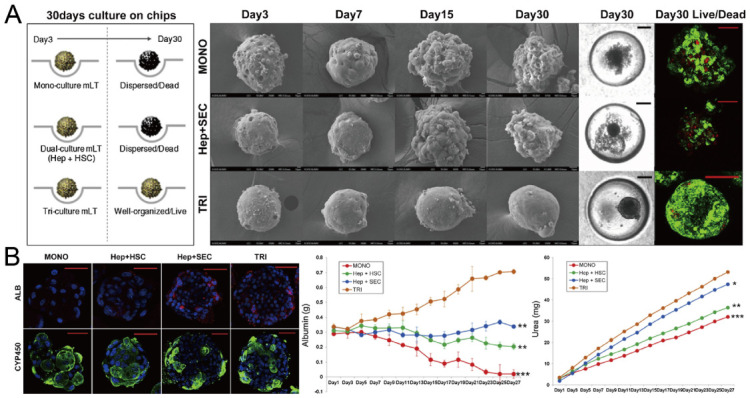
Formation of hepatic spheroids by different culture modes, and the comparison of their secretion of albumin and urea [92]. (A) Culture of spheroids by mono-culture of hepatocytes, co-culture of hepatocytes and hepatic stellate cells, tri-culture of hepatocytes, hepatic stellate cells and sinusoidal endothelial cells over time. Black scale bars: 100 µm, red scale bars: 50 µm. (B) Different spheroids with serum albumin (red), CYP450 reductase (green) and nuclei (blue) stained (left), and the secretion of albumin (middle) and urea with time (right). * p < 0.05, ** p < 0.01, *** p < 0.001. Scale bars: 50 µm. Reprinted (adapted) from [92]. Copyright (2014) with permission from Elsevier.
