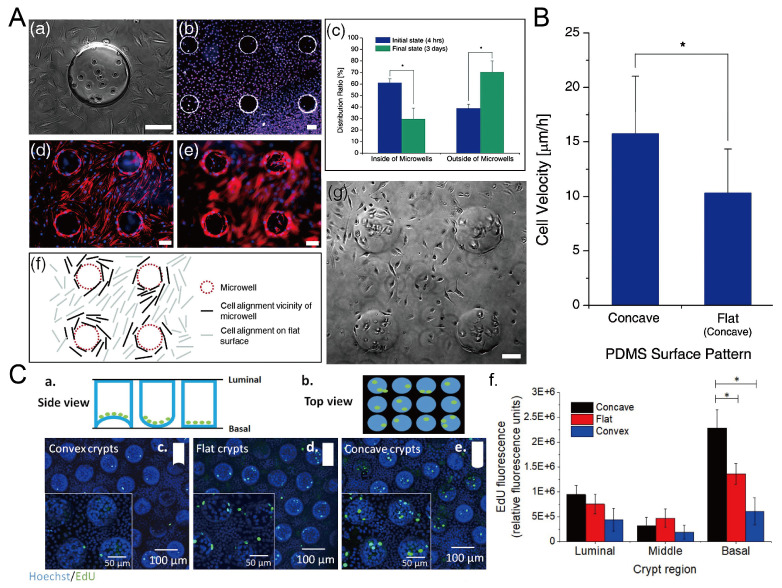
Figure 23.
The behavior of cells in concave microwells. (A) 4 h after the seeding of L929 cells on the PDMS substrate with concave microwells (a), fluorescent images of L929 cells after three days of culture (b), the distribution of cells inside and outside of concave microwells in 4 h and 3 days after seeding (c), fluorescent images of human mesenchymal stem cells (hMSCs) cultured on PDMS substrate with concave microwells, of which the focus plane is on the flat plane (d) and concave microwells (e) respectively, the pattern of cells close to the microwells (f), and the status of L929 cells after three-day culture on the substrate with concave microwells (g) [69]. * p < 0.01. Scale bars: 100 µm. (B) Comparison of cell velocity on concave and flat surfaces [69]. ‘*’ indicates a significant difference (p = 0.034). Reprinted (adapted) from [69]. Copyright (2009) with permission from Royal Society of Chemistry. (C) Schematic side view (a) and top view (b) of primary human colonic epithelial cell culture in microwells with different shapes, fluorescent images of cells cultured on different bases (c–e), and the comparison of 5-ethynyl-2-deoxyuridine (EdU) fluorescence of cells cultured on different bases (f) [102]. * p < 0.001. Reprinted (adapted) from [102]. Copyright (2021) with permission from IOP Publishing.

