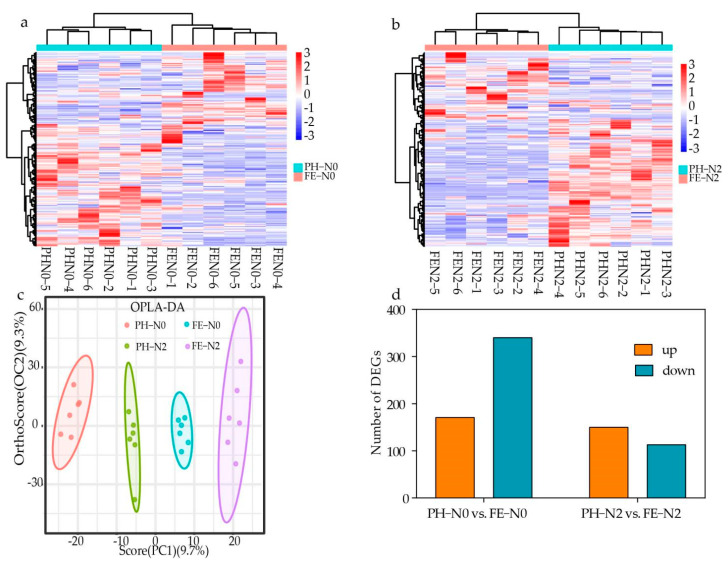
Figure 3.
Different effects of nitrogen fertilization on metabolomic for application at different growth stages. (a,b) Heat map (c) OPLS-DA (d) Upregulation—downregulation metabolite bar chart of different metabolites in peach fruit fertilized during different growth stages using different nitrogen supply levels. PH-N0, 0 kg N ha−1 application at the fruit pit hardening stage; PH-N2, 200 kg N ha−1 application at the fruit pit hardening stage; FE-N0, 0 kg N ha−1 application at the fruit expansion stage; FE-N2, 200 kg N ha−1 application at the fruit expansion stage. The abscissa of heat map indicates the sample name and hierarchical clustering results, and the ordinate of heat map indicates differential metabolites and hierarchical clustering results.

