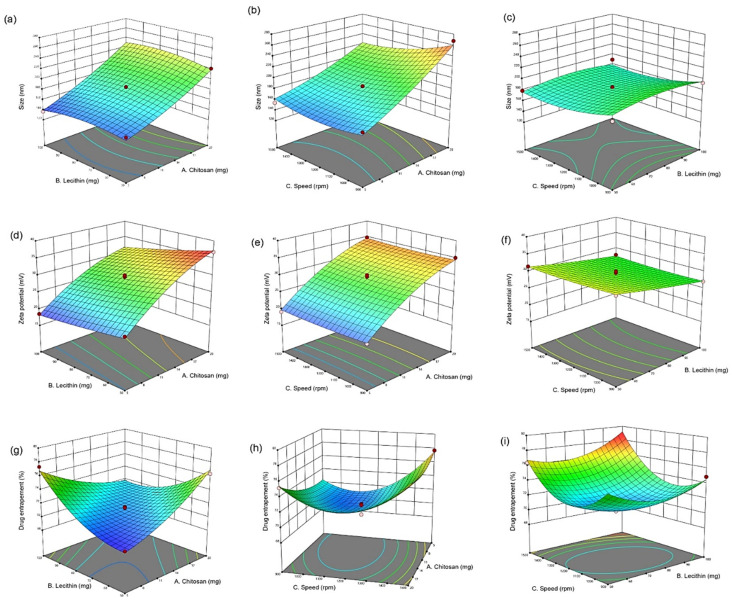
Figure 1.
3D-response surface plots for the graphical optimization of CUR/LCSNPs, illustrating the interaction effect of (a) lecithin and chitosan on mean particle size. (b) Speed and chitosan on mean particle size. (c) Speed and lecithin on mean particle size. (d) Lecithin and chitosan on ZP. (e) Speed and chitosan on ZP. (f) Speed and lecithin on ZP. (g) Lecithin and chitosan on EE(%). (h) Speed and chitosan on EE (%). (i) Speed and lecithin on EE (%).

