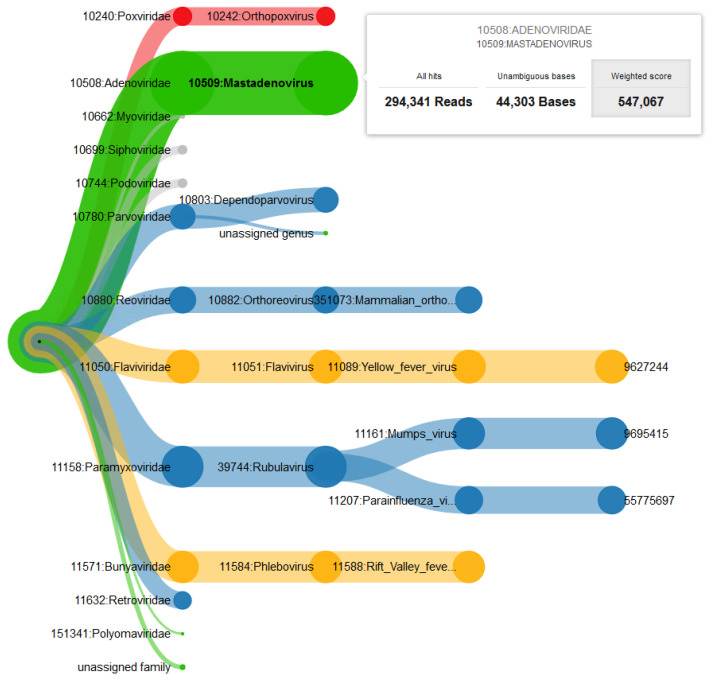
Figure 3.
Example of the interactive taxonomic tree of results. The results show the described plasma sample at cycle 80 based on the weighted score. Thickness of the branches denotes the sum of scores of underlying sequences. The color codes for the maximum of the underlying BLS-levels (red = 4, yellow = 3, blue = 2, green = 1 or undefined; phages are shown in grey). On mouse-over, detailed information (here on genus Mastadenovirus) is displayed. The selected score (here: weighted score) is highlighted in grey. PathoLive detects all 7 prevalent viruses as the top hits. Additionally, the visualization clearly emphasizes all spiked pathogens through the thickness of their clades, while other species are shown only in smaller clades and therefore ranked lower. The results do not change significantly in the later stages of the run.

