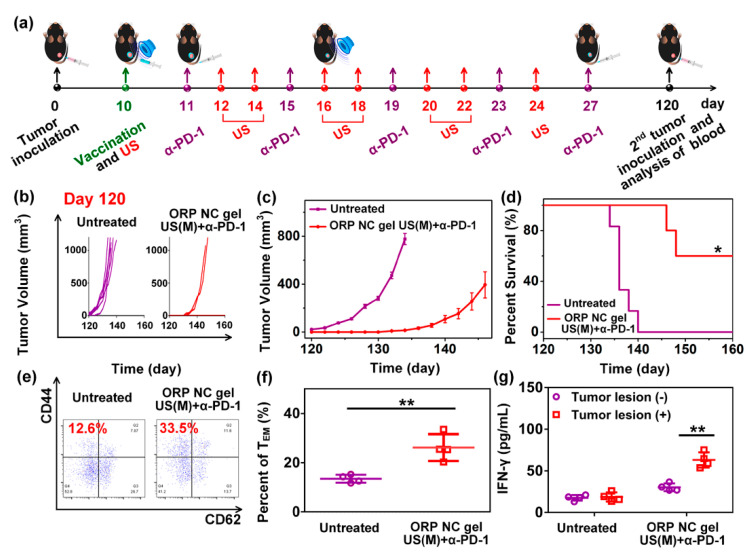
Figure 13.
Long-term immune memory effect of the ORP NC gel. (a) The sequence of injections and ultrasound treatment, (b) individual and (c) average tumor growth curves mice with rechallenged tumors, (d) percent survival of mice after immunization with the treatments indicated in (b,e) representative flow cytometry plots and (f) statistic data (f), to show proportions of effector memory TEM in the peripheral blood at day 120, and (g) IFN-γ secretion from restimulated peripheral blood lymphocytes collected on day 120. Growth curves represent mean ± SEM. Survival curves were obtained using the Kaplan−Meier method. Data are presented as mean ± SD (n = 4). * p < 0.05, ** p < 0.01 [105].

