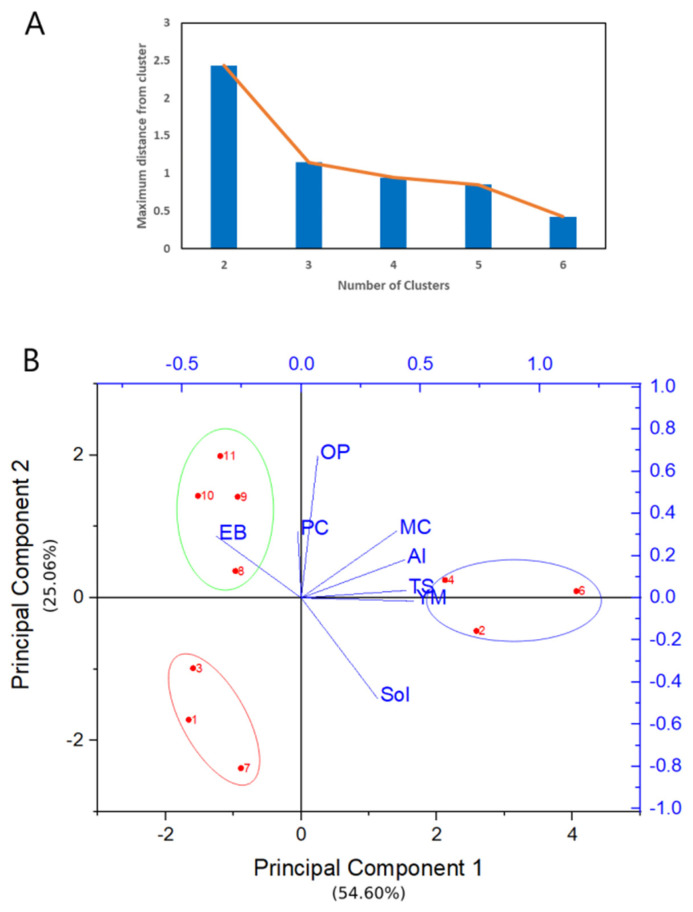
Figure 4.
Relationship between the maximum distance to a cluster and the number of clusters during the k-means cluster analysis (A) and the PCA biplot between the first two principal components (B) where dots represent the scores plot and lines represent the loadings plot (Al, alginate; PC, phenolic compounds; Sol, solubility; MC, moisture content; YM, Young Modulus; OP, opacity; TS, tensile strength; EB, elongation at break).

