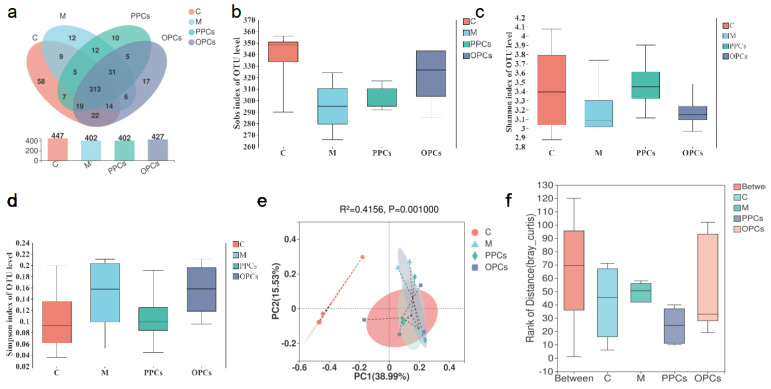
Figure 4.
Gut microbiota composition of P-PCs and P-OPCs treatment mice. C57BL/6 mice were fed a HFD with the administration of P-PCs and P-OPCs. (a) OTU numbers of gut microbiota in different treatment groups; (b) Sobs indexes of OTU level; (c) Shannon indexes of OTU level; (d) Simpson indexes of OTU level; (e,f) PCoA analysis of the gut microbiota composition at OTU level.

