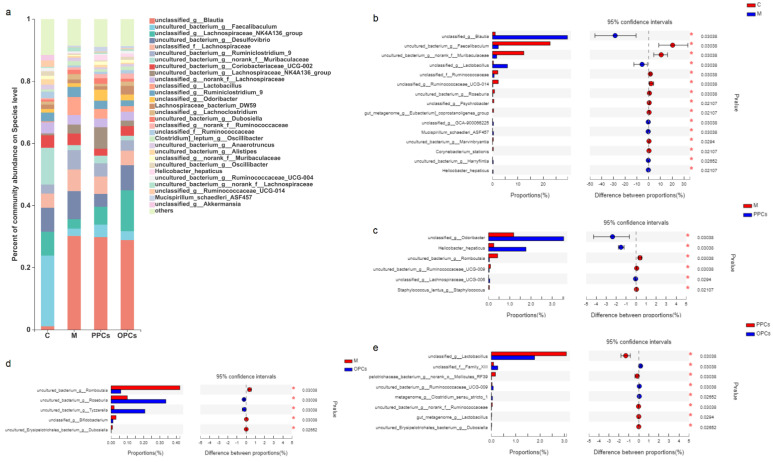
Figure 7.
Gut microbiota composition at species level. (a) Relative abundance of gut microbiota at species level; (b) the differences of gut microbiota between C and M groups; (c) the differences of gut microbiota between M and PPCs groups; (d) the differences of gut microbiota between M and POPCs groups; (e) the differences of gut microbiota between PPCs and OPCs groups. Data were analyzed by Wilcoxon rank-sum test, * p < 0.05.

