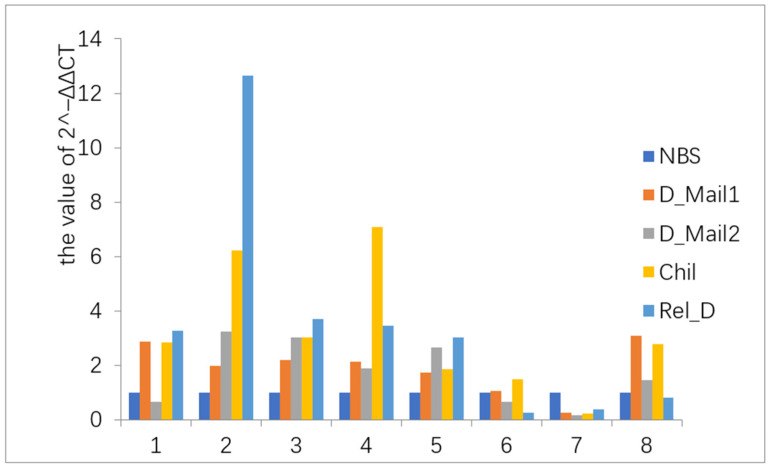
Figure 2.
Quantitative reverse transcription RT-PCR analysis. The horizontal coordinates indicate the eight randomly selected genes (Supplementary Table S1). The vertical coordinate indicates the value of 2^−ΔΔCt. The expression trends of these eight genes in the five phases were the same as the transcriptome, indicating the data are true and reliable. Gene expression levels in the NBS phase were set to 1, whereas gene expression levels in other phases were considered as upregulated for values of more than 1 and downregulated for values of less than 1.

