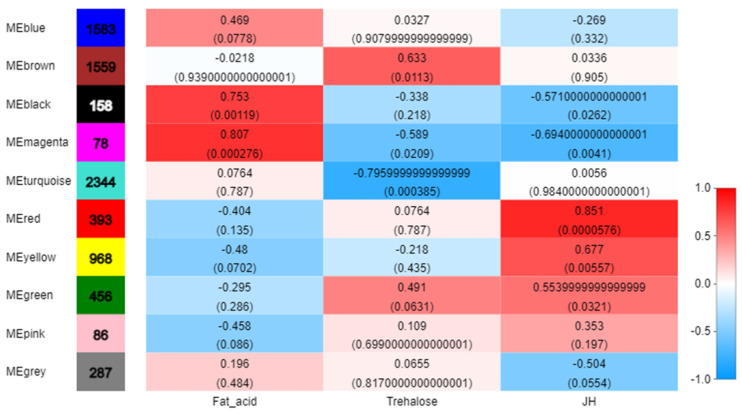
Figure 7.
Correlation of modules with each physiological index. Horizontal coordinates represent fatty acids, trehalose, and JH, and vertical coordinates represent different gene modules. The left column of the graph indicates the number of genes in the module, and each set of data on the right indicates the correlation coefficient and significant p-value (in parentheses) of the module with the phenotype. The default designation of red and blue means that the module is more and less correlated with the phenotype, as indicated by the numbers under the color bar at the bottom right.

