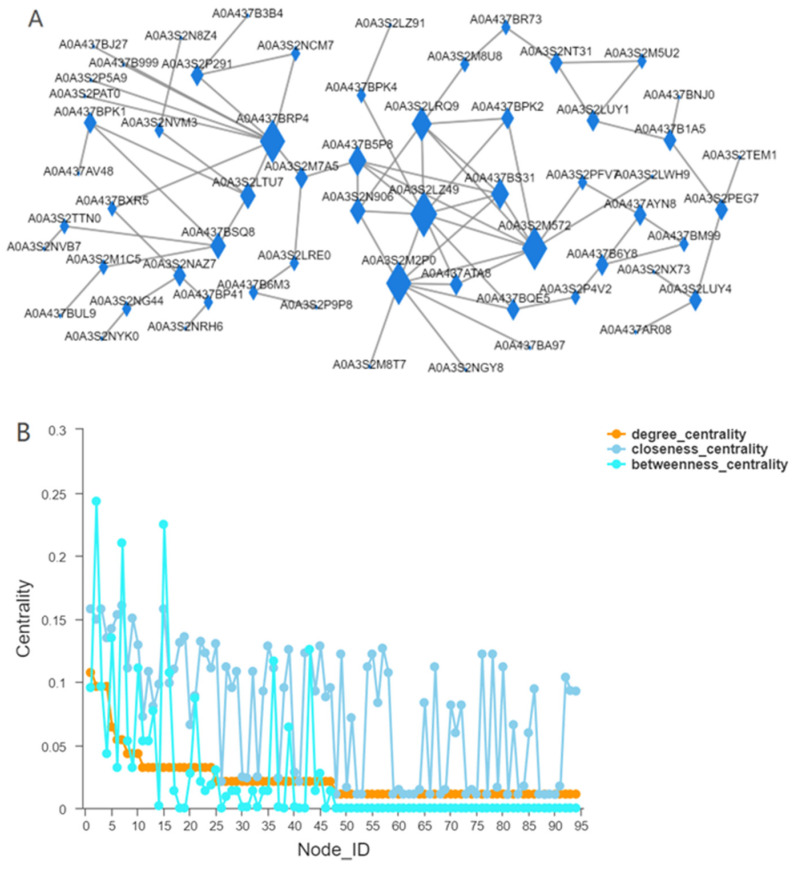
Figure 9.
Protein interaction network. (A): Nodes represent genes, and edges represent interactions between two genes. The size of a node is directly proportional to the connectivity (degree) of the node; that is, the more edges connected to the node, the larger the degree of the node will be, indicating the stronger the importance of genes in the network. (B): The horizontal coordinate is the ID of the node, and the vertical coordinate is Centrality. The larger the value is, the more important the node is in the network. In the figure, the blue color represents betweenness centrality, which reflects the role of a node in connection with other nodes. It means that the node plays a more important role in maintaining the tight connectivity of the whole network); Orange represents degree centrality (degree centrality is the most direct metric to describe node centrality in network analysis. The greater the degree of a node is, the higher the degree centrality of the node is, and the more important the node is in the network). Light blue represents the closeness coefficient (which is the distance between a node and other nodes in the network, if all are very short, the point is the center of the whole, and the larger the value is, the closer the node is to the center of the network).

