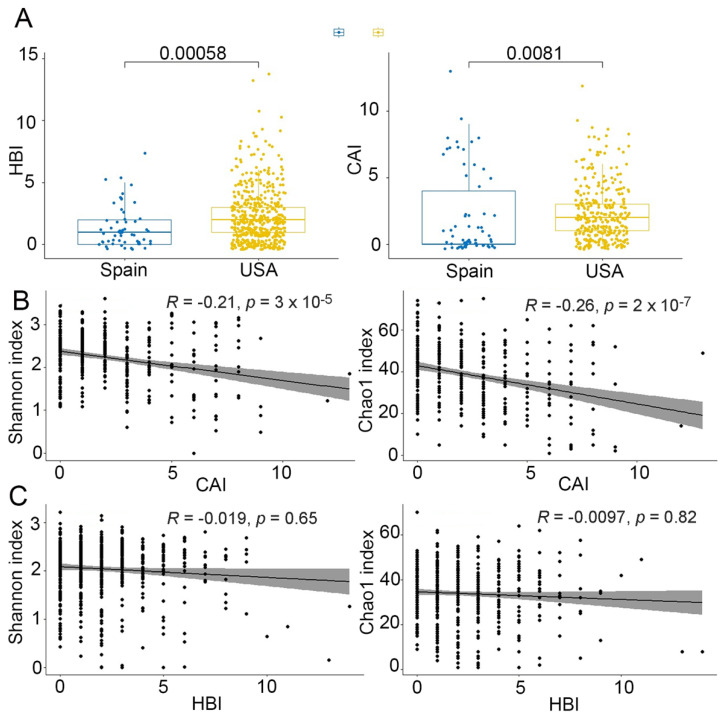
Figure 3.
Disease activity score in CD (HBI, Harvey-Bradshaw index) and UC (CAI, colitis activity score). (A) HBI and CAI were both higher in the USA than in the Spanish cohort (Mann Whitney’s U test). (B) Correlation between alpha-diversity (Shannon and Chao1 indices) and CAI (Spearman correlation test). rho = −0.019, p = 0.65 for the Shannon index and rho = −0.0097, p = 0.82 for the Chao1 index. (C) Correlation between alpha-diversity (Shannon and Chao1 indices) and HBI (Spearman correlation test). rho = −021, p = 3 × 10⁻⁵ for the Shannon index and rho = −0.26, p = 2 × 10⁻⁷ for the Chao1 index.

