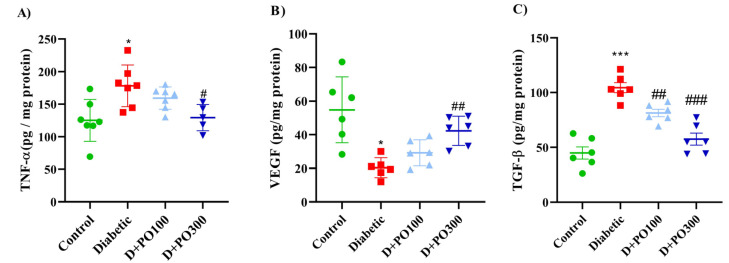
Figure 12.
The effects of PO extract on the levels of (A) TNF-α, (B) VEGF, and (C) TGF-ꞵ levels in diabetic rats. The data are presented as mean ± SD. A one-way ANOVA test was carried out with the following Tukey–Kramer’s post hoc test; * p < 0.05, *** p < 0.001 vs. control group; # p < 0.05, ## p < 0.01, ### p < 0.001 vs. diabetic group.

