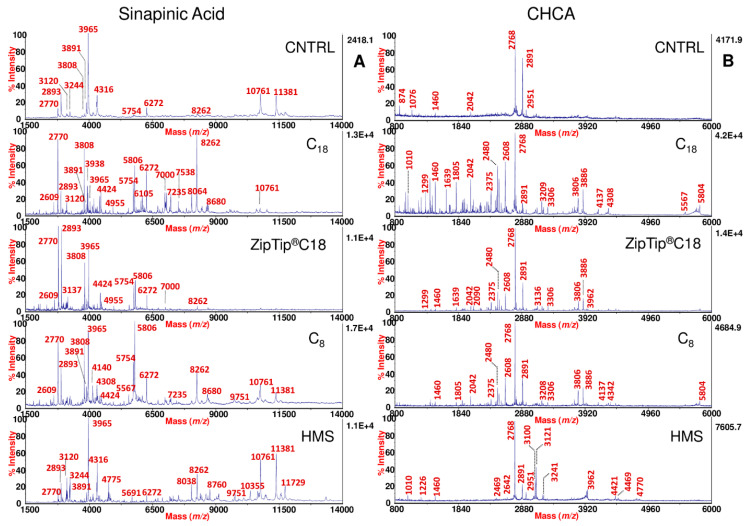
Figure 1.
MALDI-TOF MS full view of SP using SA and CHCA matrices. MALDI-TOF mass spectra of SP obtained from the same fertile normozoospermic man using SA (A) and CHCA (B) as matrix, before and after processing by C18, ZipTip®C18, C8, and HMS. For SA, the spectra are shown in the m/z range from 1500 to 14,000. For CHCA, the spectra are shown in the m/z range from 800 to 6000, with labeled monoisotopic peaks.

