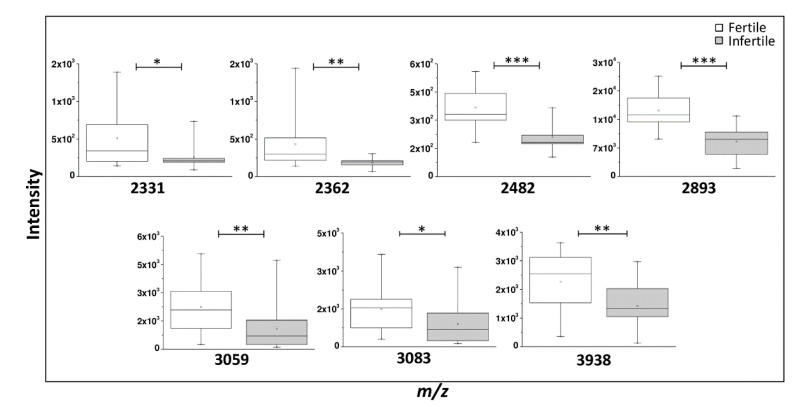
Figure 5.
Main discriminant peaks box plot analysis. Box plot of the peak intensities for statistically discriminant m/z signals between 15 fertile and 15 infertile men performed by OriginLab® software. The p values were calculated with unpaired t-test on normalized peak intensity and the asterisks show the level of significance between the two groups; * p values < 0.01, ** p values < 0.005, *** p values < 0.0001.

