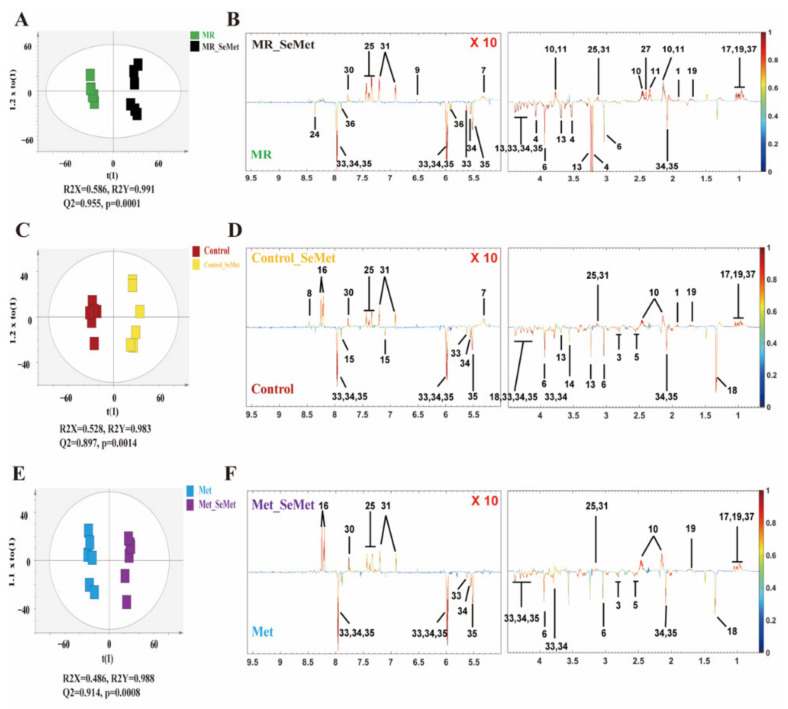
Figure 4.
OPLS-DA scores plots (left) and corresponding loadings plots (right) derived from the 1H NMR data for HepG2 cell extracts: (A) Scores plot of the model constructed between MR and MR_SeMet groups; (B) Loading plot of changed metabolites between MR and MR_SeMet groups; (C) Scores plot of the model constructed between control and control_SeMet groups; (D) Loading plot of changed metabolites between control and control_SeMet groups; (E) Scores plot of the model constructed between Met and Met_SeMet groups; (F) Loading plot of changed metabolites between Met and Met_SeMet groups. Keys: 1. Acetate; 3. Aspartate (Asp); 4. Choline; 5. Citrate; 6. Creatine; 8. Formate; 9. Fumarate; 10. Glutamate (Glu); 11. Glutamine (Gln); 13. Glycerophosphocholine (GPC); 14. Glycine (Gly); 15. Histidine (His); 16. Hypoxanthine; 17. Isoleucine (ILe); 18. Lactate; 19. Leucine (Leu); 24. Nicotinamide Adenine Dinucleotide (NAD); 25. Phenylalanine (Phe); 27. Succinate; 30. Tryptophan (Trp); 31. Tyrosine (Tyr); 33. UDP-Glucuronate; 34. UDP-N-acetylgalactosamine; 35. UDP-N-acetylglucosamine; 36. Uridine; 37. Valine (Val).

