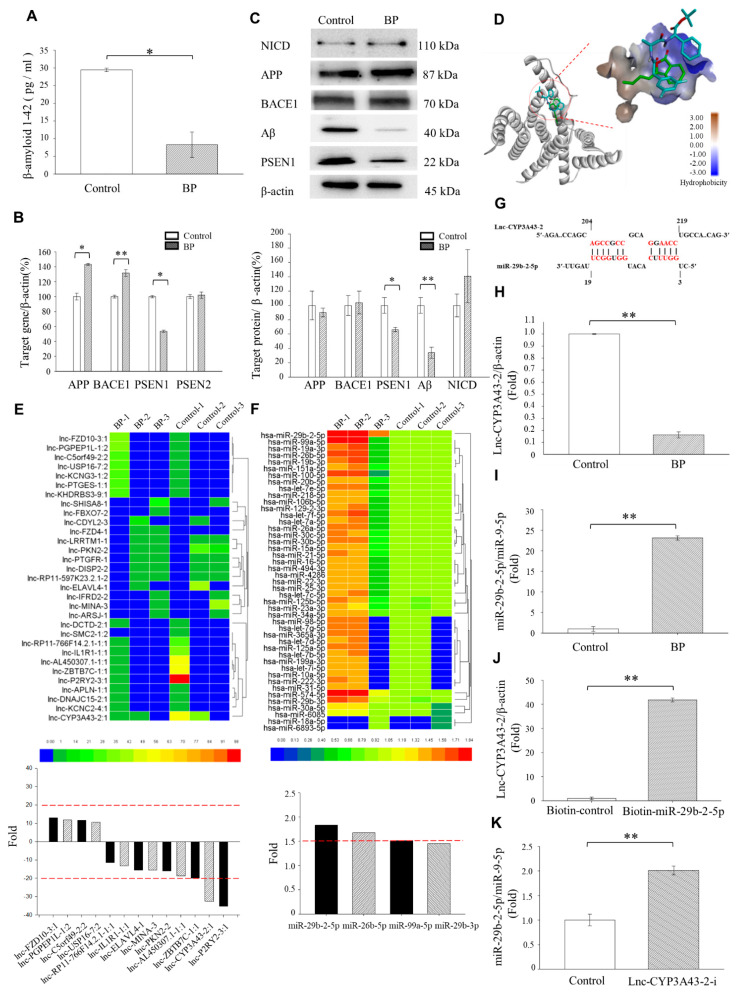
Figure 1.
Increased miRNA-29b-2-5p expression and decreased PSEN1 and Aβ expressions in BP-treated Ts21-iPSC-derived neurons. (A) Quantification of Aβ42 levels in the medium of control and BP-treated cells evaluated using ELISA (Control = 29.44 pg/mL ± 1.05, BP = 8.28 pg/ml ± 7.31), n = 3 for each group. (B) The expression of AD-associated gene/β-actin with or without 100 μM BP (APP of Control = 100% ± 4.5 vs. BP = 144.59% ± 1.19; BACE1 of Control = 100% ± 1.79 vs. BP = 131% ± 4.44; PSEN1 of Control = 100% ± 6.0 vs. BP = 51.9% ± 1.52), n = 3 for each group. (C) Representative western blot analysis of APP, BACE1, PSEN1, and Aβ levels after 48 h with or without 100 μM BP (APP of Control = 100% ± 24.03 vs. BP = 89.96% ± 7.54; BACE1 of Control = 100% ± 18.57 vs. BP = 103.94 % ± 20.79; PSEN1 of Control = 100% ± 16.37 vs. BP = 65.94% ± 6.86; Aβ of Control = 100% ± 16.13 vs. BP = 39.59% ± 6.63). (D) The binding structure simulation between BP (green stick) and DAPT (cyan stick) with PSEN1. (Left) The gray ribbon shows the 3D structure of PSEN1; (right) the enlargement of the active site of PSEN1 is shown by the surface model. The red color indicates the amino acids with strong hydrogen-bonding donor properties. (E,F) Gene microarray analysis of lncRNA and miRNA after BP treatment of Ts21-iPSCs and controls. (G) The predicted binding sites between lnc-CYP3A43 and miR-29b-2-5p. (H,I) RT-qPCR analysis of the expression levels of lnc-CYP3A43-2/β-actin and miR-29b-2-5p/miR-9-5p (lnc-CYP3A43-2/β-actin: Control = 1fold ± 0.02 vs. BP: 0.17fold ± 0.05; miR-29b-2-5p/miR-9-5p: Control = 1fold ± 0.09 vs. BP = 23.11fold ± 0.12), n = 3. (J) Real-time PCR results of miRNA expression from biotin-based pulldown assay validate the lnc-CYP3A43-2 targets of cellular miR-29b-2-5p (Control = 1fold ± 0.25 vs. BP = 41.81fold ± 0.09), n = 3. (K) Real-time PCR results of cellular miR-29b-2-5p expression levels after the inhibition of lnc-CYP3A43-2(Control = 1fold ± 0.17 vs. BP = 1.87fold ± 0.11), n = 3. * p < 0.05. ** p < 0.01.

