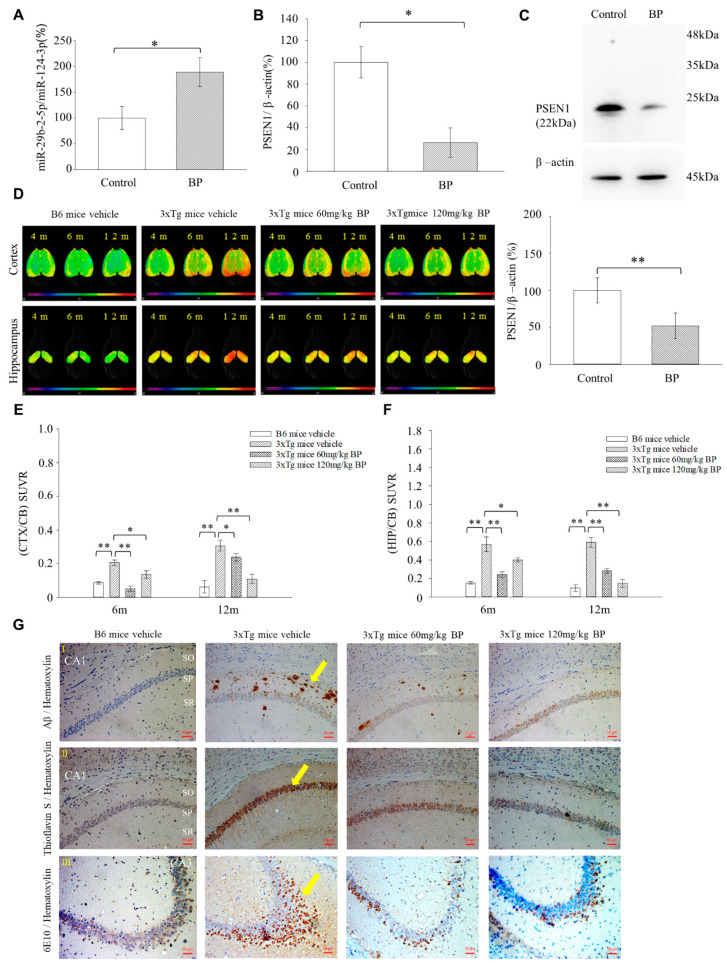
Figure 4.
BP decreased Aβ deposition in the hippocampus of 3xTg mice. RT-PCR analysis of the expression levels of miR-29b-2-5p gene (A) and PSEN1 gene (B) in the hippocampus of BP-treated 3xTg mice (miR-29b-2-5p: Control = 100% ± 28.4 vs. BP = 189.49% ± 14.82; PSEN1: Control = 100% ± 19.22 vs. BP = 26.26% ± 23.24), n = 4. (C) western blot analysis of PSEN1 in the hippocampus of BP-treated 3xTg AD mice. PSEN1 was reduced in the BP treated group (Control = 100% ± 23.20 vs. BP = 51.79% ± 19.73), n = 4. * p < 0.05. ** p < 0.01. (D) 3D radiotracer [18F]-FBB images show Aβ accumulation in the brains of 3xTg mice. After 4–12 months, the B6 control mice exhibited no Aβ accumulation (green color). The 3xTg transgenic mice demonstrated amyloid deposits in the hippocampus (HIP) and cortex (CTX) of the brain and tended to accumulate amyloids after 12 months of birth (orange-red color). Oral administration of BP (60 or 120 mg/kg) resulted in low levels of amyloid accumulation. SUVR; standard uptake value ratio, M; months, cerebellum: CB. Comparison of VOI-based [18F]-FBB SUVR (CTX/CB) (E) and SUVR (HIP/CB) (F) between vehicle-treated B6 mice, vehicle-treated 3xTg transgenic, and BP-treated 3xTg mice (60 mg/kg and 120 mg/kg) at the age of 6 and 12 months (CTX/CB-6m: Vehicle-treated B6 mice = 0.09 ± 0.01, Vehicle-treated 3xTg mice = 0.21 ± 0.04, 60 mg/kg BP-treated 3xTg mice = 0.06 ± 0.01, 120 mg/kg BP-treated 3xTg mice = 0.13 ± 0.05; CTX/CB-12m: Vehicle-treated B6 mice = 0.06 ± 0.04, Vehicle-treated 3xTg mice = 0.30 ± 0.03, 60 mg/kg BP-treated 3xTg mice = 0.23 ± 0.03, 120 mg/kg BP-treated 3xTg mice = 0.10 ± 0.03; HIP/CB-6m: Vehicle-treated B6 mice = 0.15 ± 0.02, Vehicle-treated 3xTg mice = 0.56 ± 0.16, 60 mg/kg-treated 3xTg mice = 0.24 ± 0.05, 120 mg/kg-treated 3xTg mice = 0.39 ± 0.04; HIP/CB-12m: Vehicle-treated B6 mice = 0.09 ± 0.07, Vehicle-treated 3xTg mice = 0.59 ± 0.11, 60 mg/kg-treated 3xTg mice = 0.28 ± 0.04, 120 mg/kg-treated 3xTg mice = 0.14 ± 0.08), n = 4 for vehicle-treated and n = 5 for vehicle-treated 3xTg mice, 60 mg/kg BP-treated 3xTg mice and 120 mg/kg BP-treated 3xTg mice. (G-I) Immunostaining with Aβ antibody to detect amyloid deposition in the CA1 area of the hippocampus. Brown dots indicated Aβ plaque accumulation (Yellow arrow). We observed Aβ plaques on both sides of the sp in vehicle-treated 3xTg transgenic mice but not in vehicle-treated B6 mice. Moreover, the Aβ plaques of 60 and 120 mg/kg BP-treated 3xTg mice were significantly reduced. (G-II) Results of Th-S staining. A similar trend of Aβ plaques in the SP areas of each group was observed in the SP area of CA1 using Th-S staining (Yellow arrow). Brain sections were selected at −2.2 mm posterior to the bregma. n = 4 for B6 mice vehicle, vehicle-treated 3xTg mice n = 5 for 60 mg/kg and 120 mg/kg BP-treated 3xTg mice. (G-III) Immunostaining with 6E10 antibody to detect amyloid deposition in the hippocampus. Brown dots indicated amino acids 6–10 of Aβ accumulation (Yellow arrow). We observed amino acids 6–10 of Aβ from CA1 diffuse to CA3 in vehicle-treated 3xTg transgenic mice but not in B6 mice. Moreover, the amino acids 6–10 of Aβ of 60 and 120 mg/kg BP-treated 3xTg mice were significantly reduced. n = 4 for B6 mice vehicle, vehicle-treated 3xTg mice. n = 5 for 60 mg/kg and 120 mg/kg BP-treated 3xTg mice. * p < 0.05. ** p < 0.01. Scale bars represent 50 μm. SO: stratum oriens; SP: stratum piramidale; SR: stratum radiatum. CA: Cornu Ammonis areas.

