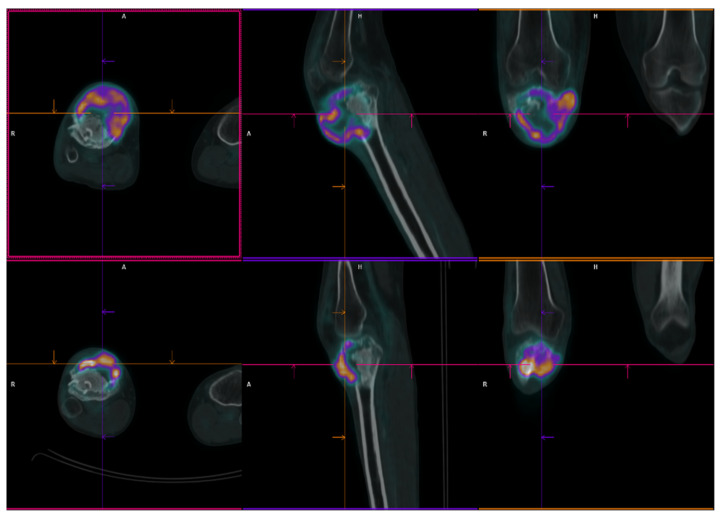
Figure 2.
18F-FDG PET/CT axial (left), sagittal (middle) and coronal (right) fused view of right knee in patient no. 2. A first PET/CT scan (lower row) showed the presence of a pathological tissue with high metabolic activity (SUVmax = 26.5) at the level of the right tibia extending to the neighbouring soft-tissue compatible with relapse. A second PET/CT scan performed three months after starting treatment with denosumab (upper row), showed a significant increase in soft-tissue component of the lesion, with stability of FDG uptake. A = anterior; R = right; H = high.

