Figure 1.
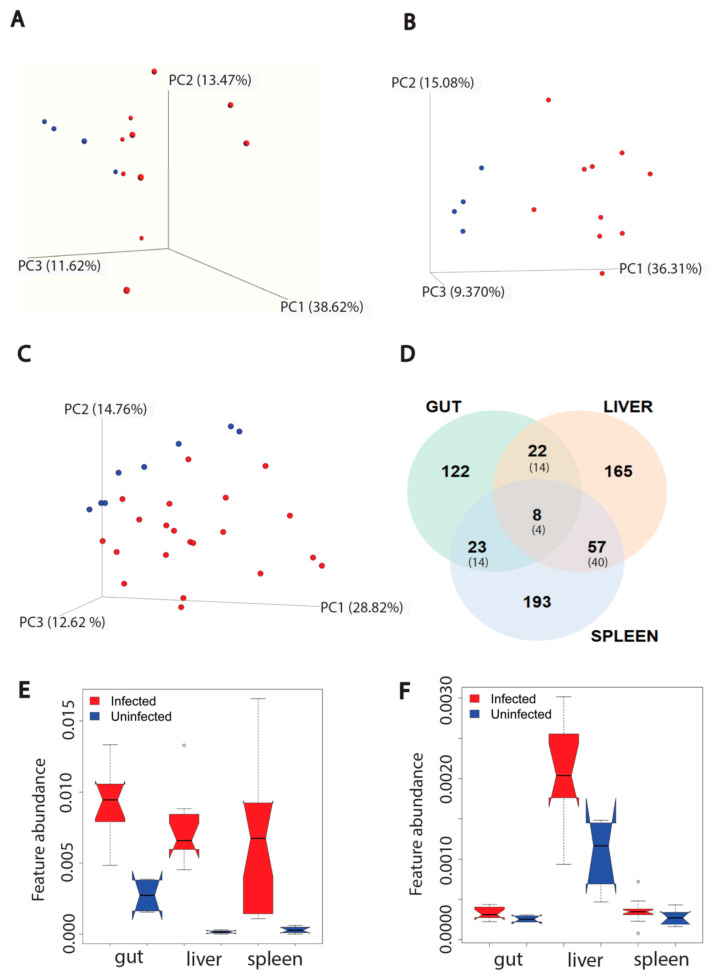
Effect of L. donovani infection on overall metabolism of host organs (gut (n = 4 uninfected and n = 10 infected), liver (n = 4 uninfected and n = 10 infected), spleen (n = 8 uninfected and n = 21 infected, two samples per animal)) in positive mode. (A) PCoA analysis of extracted metabolites from infected and uninfected gut samples (PERMANOVA R2 = 0.134, p-value > 0.05). Each sphere represented one sample. Red color represented infected samples and blue color, uninfected samples. (B) PCoA analysis of extracted metabolites from infected and uninfected liver samples (PERMANOVA R2 = 0.309, p-value < 0.01). (C) PCoA analysis of extracted metabolites from infected and infected spleen samples (PERMANOVA R2 = 0.137, p-value < 0.01). (D) Venn diagram representing the number of metabolites perturbed by infection at each organ. Smaller font numbers in parentheses show the number of metabolites commonly perturbed between indicated organs and that have the same direction of change in response to infection. (E) Kynurenine metabolite increased by infection in three organs. ∘, Wilcoxon rank-sum test with FDR correction, p-value < 0.01. (F) Riboflavin increased by infection only in liver. ∘, Wilcoxon rank-sum test with FDR correction, p-value < 0.01 in liver. Feature abundance is quantified as TIC-normalized peak area.

