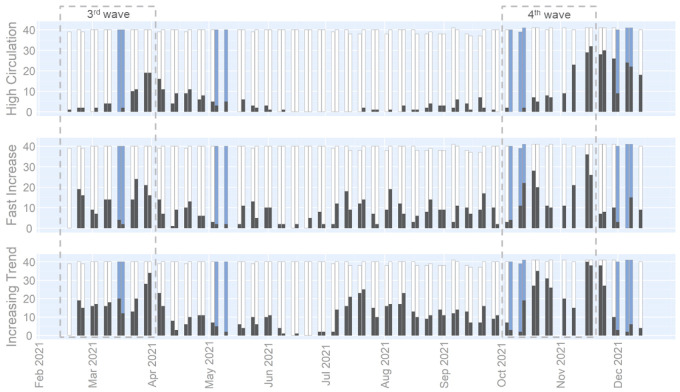
Figure 2.
Evolution of the number of areas for which the wastewater indicators are positives. The indicators are computed on the viral concentration (SARS-CoV-2 RNA gene copies/mL) with the 3rd wave as reference period (15/02/2021–01/04/2021): High Circulation, Fast Increase, and Increasing Trend. The number of areas for which each indicator is positive or not is indicated by black and white bars, respectively. Wastewater samples impacted by the rain are marked with blue bars. Total number may be lower than 42 when technical issues prevented samples to be taken for some of the wastewater treatment plants.

