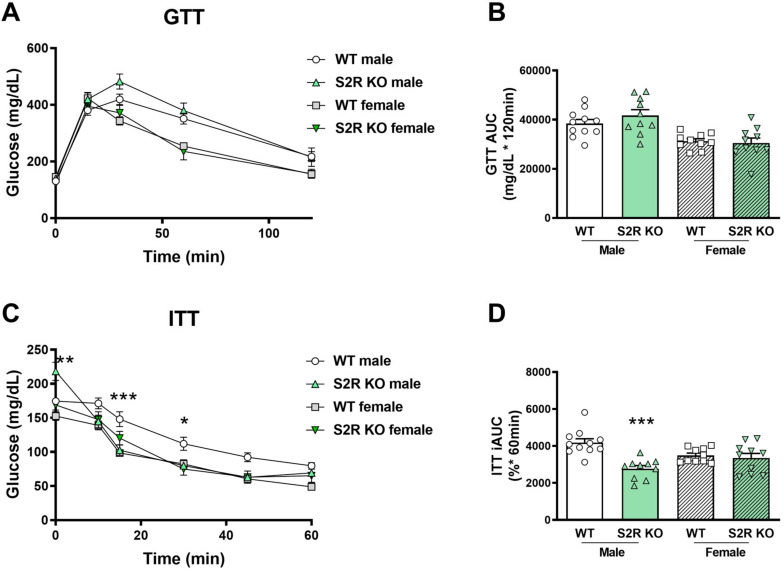
Figure 4.
S2R ablation increases insulin tolerance in male, but not female, mice fed on HFD. GTT and ITT assays were performed after 6 weeks of HFD. (A). Time course of blood-glucose levels following i.p. injection of glucose (2.0 g/kg body weight). (B). Cumulative blood-glucose levels at 120 min after glucose injection. (C). Time course of blood-glucose levels following i.p. injection of insulin (1 U/kg body weight). (D). Cumulative blood-glucose levels at 120 min after insulin injection. Statistical analysis: Two-way ANOVA with Bonferroni’s multiple-comparisons test (* p < 0.05, ** p < 0.01, *** p < 0.001), S2R KO vs. WT, n = 10 or 11 mice. In (B,D), each dot (data point, please see the circle, triangle, and square symbols) represents the area under the curve (AUC) for each individual animal. Data are presented as means ± SE. iAUC: Inverse AUC, normalized to baseline levels.

