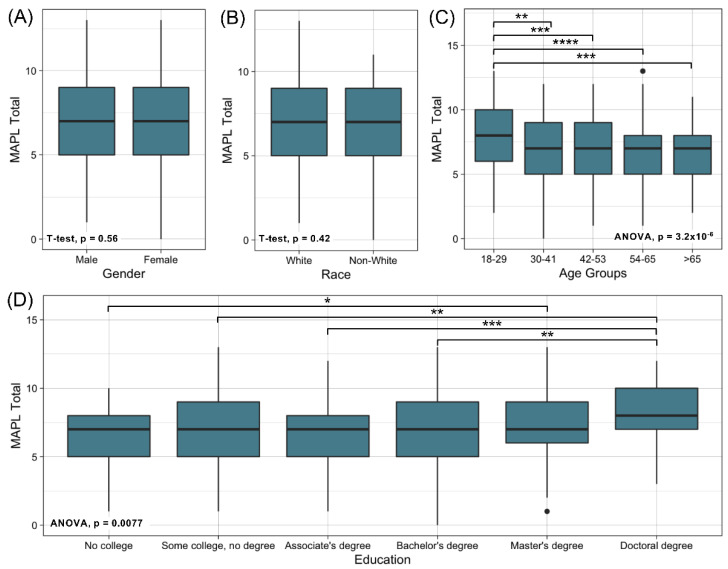
Figure 4.
MAPL performance by demographic characteristics. (A). Race; (B). Gender; (C). Age; (D). Education. Black dots in boxplots denote individual data points that are located outside 1.5 times the interquartile range above the upper quartile and below the lower quartile. **** p < 0.0001; *** p < 0.001; ** p < 0.01; * p < 0.05.

