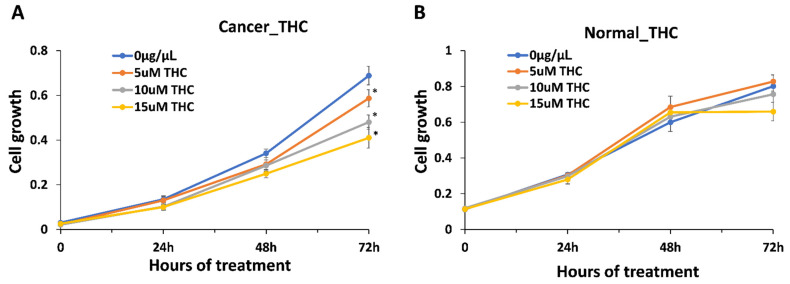
Figure 3.
Inhibition of growth of breast cancer cell line HCC1806 and normal cell line BJ-5ta in response to THC. (A)—growth curve of HCC1806 cells in response to 5, 10 and 15 μM of THC; (B)—growth curve of BJ-5ta cells in response to 5, 10 and 15 μM of THC. Y axis shows arbitrary units of cell growth, while X axis shows the time of treatment. MTT assay was performed and data were expressed as an average (from 3 independent replicates) with SD. Asterisks indicate significant (p < 0.05) difference from control (0 μg/μL ).

