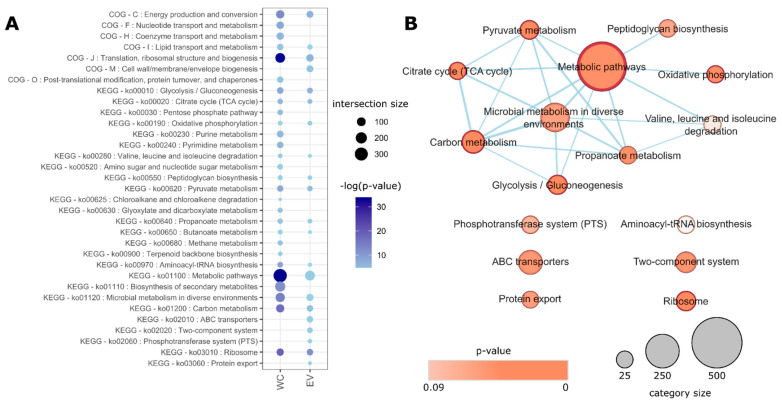
Figure 3.
KEGG and COG categories that are enriched in S. aureus HG003 WC and EV proteomes. (A) Significantly enriched COG and KEGG terms that were associated with WC and/or EV groups. Darker colors represent more significant p-values (in logarithm scale) and bubble sizes represent the number of proteins in that category that were identified in the respective sample (the intersection size). (B) Enrichment map for EV-related KEGG terms, showing significant functional categories, their total sizes, and relationships (protein sharing).

